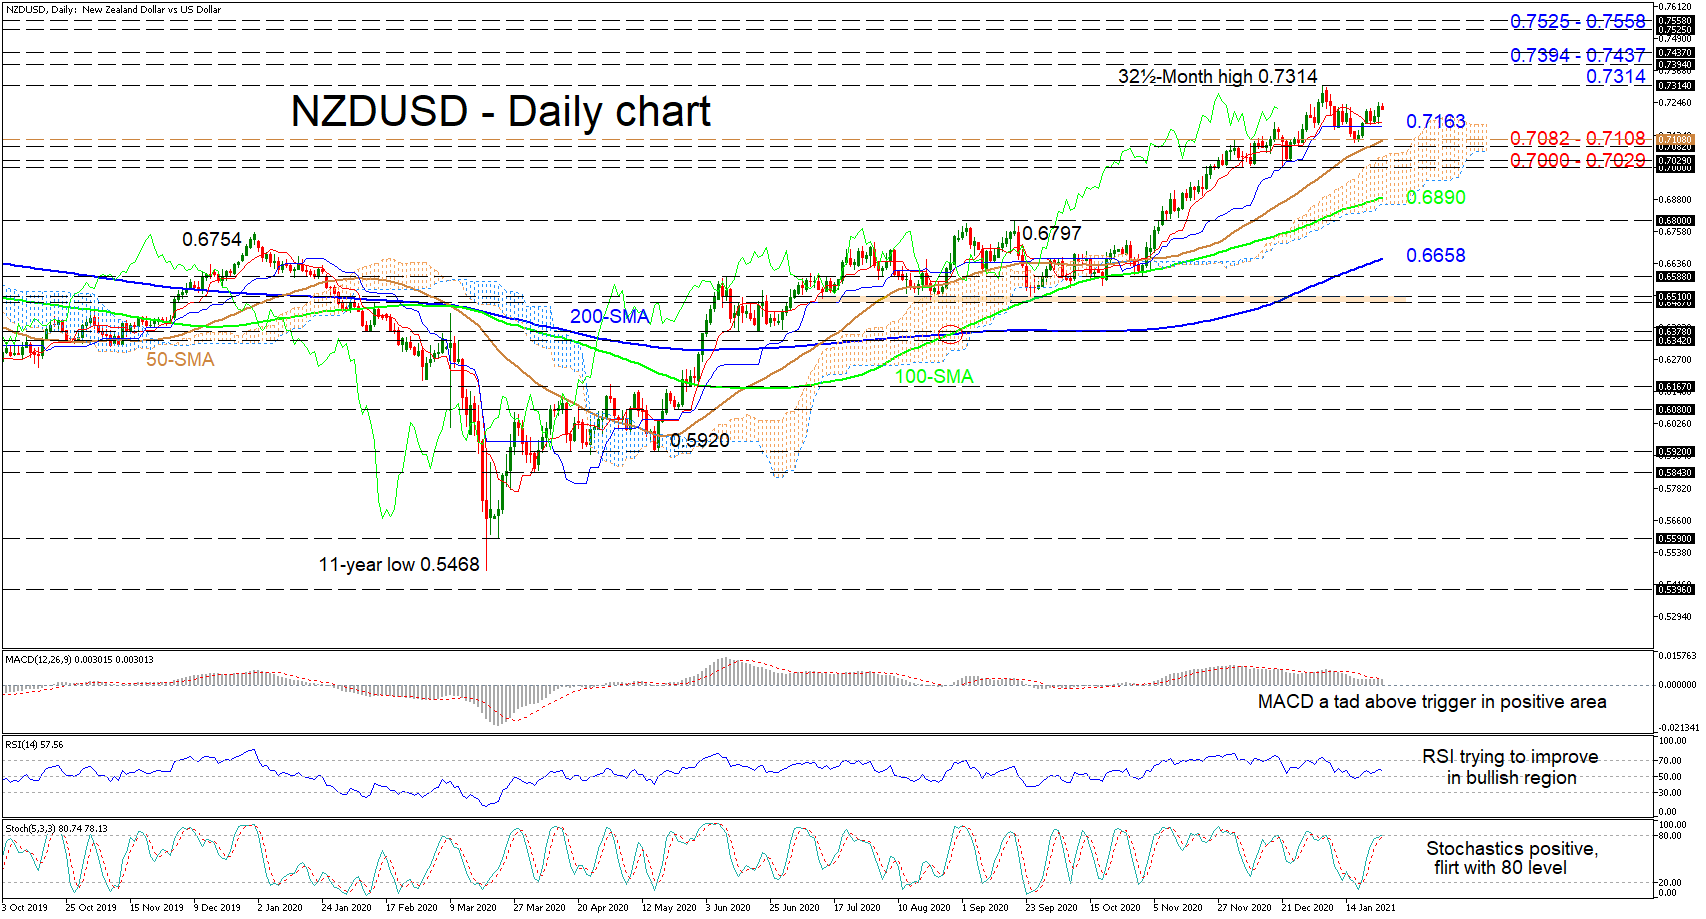
 NZDUSD is finding some support from the flattening Ichimoku lines while primarily creeping sideways, after the small pullback from the multi-year high of 0.7314. The Ichimoku lines are reflecting the pause in advances, while the soaring simple moving averages (SMAs) are protecting the bullish picture.
The short-term oscillators are demonstrating minor stalling in positive momentum. The MACD, in the positive zone, is pushing back above its red trigger line, while the RSI is trying to sustain improvements in the bullish territory. Furthermore, the positively charged stochastic oscillator is tackling the 80 overbought level.
If the pair gains traction off the Ichimoku lines, upside limitations may originate at the 32½-month high of 0.7314. Should buyers manage to resume the climb, the pair could encounter heavy resistance at the region of highs of 0.7394-0.7437. Conquering this boundary, which curbed advances for three months back in 2018, the price could then target the 0.7525-0.7558 barrier.
However, if sellers dip underneath the Ichimoku lines around 0.7163, neighbouring support could develop from the 50-day SMA at 0.7108 until the 0.7082 low. Retracing further down and into the cloud, the key support section of 0.7000-0.7029 could attempt to dismiss any additional losses. Yet, should the decline claim victory, the pair may aim for the cloud’s lower band and the forthcoming 100-day SMA at 0.6890.
Summarizing, NZDUSD’s bullish bias remains robust above the SMAs, the cloud and the 0.7000-0.7029 border. A continued push off the Ichimoku lines could boost positive price action, while a slide below the 50-day SMA could signal waning in the pair.
Origin: XM