


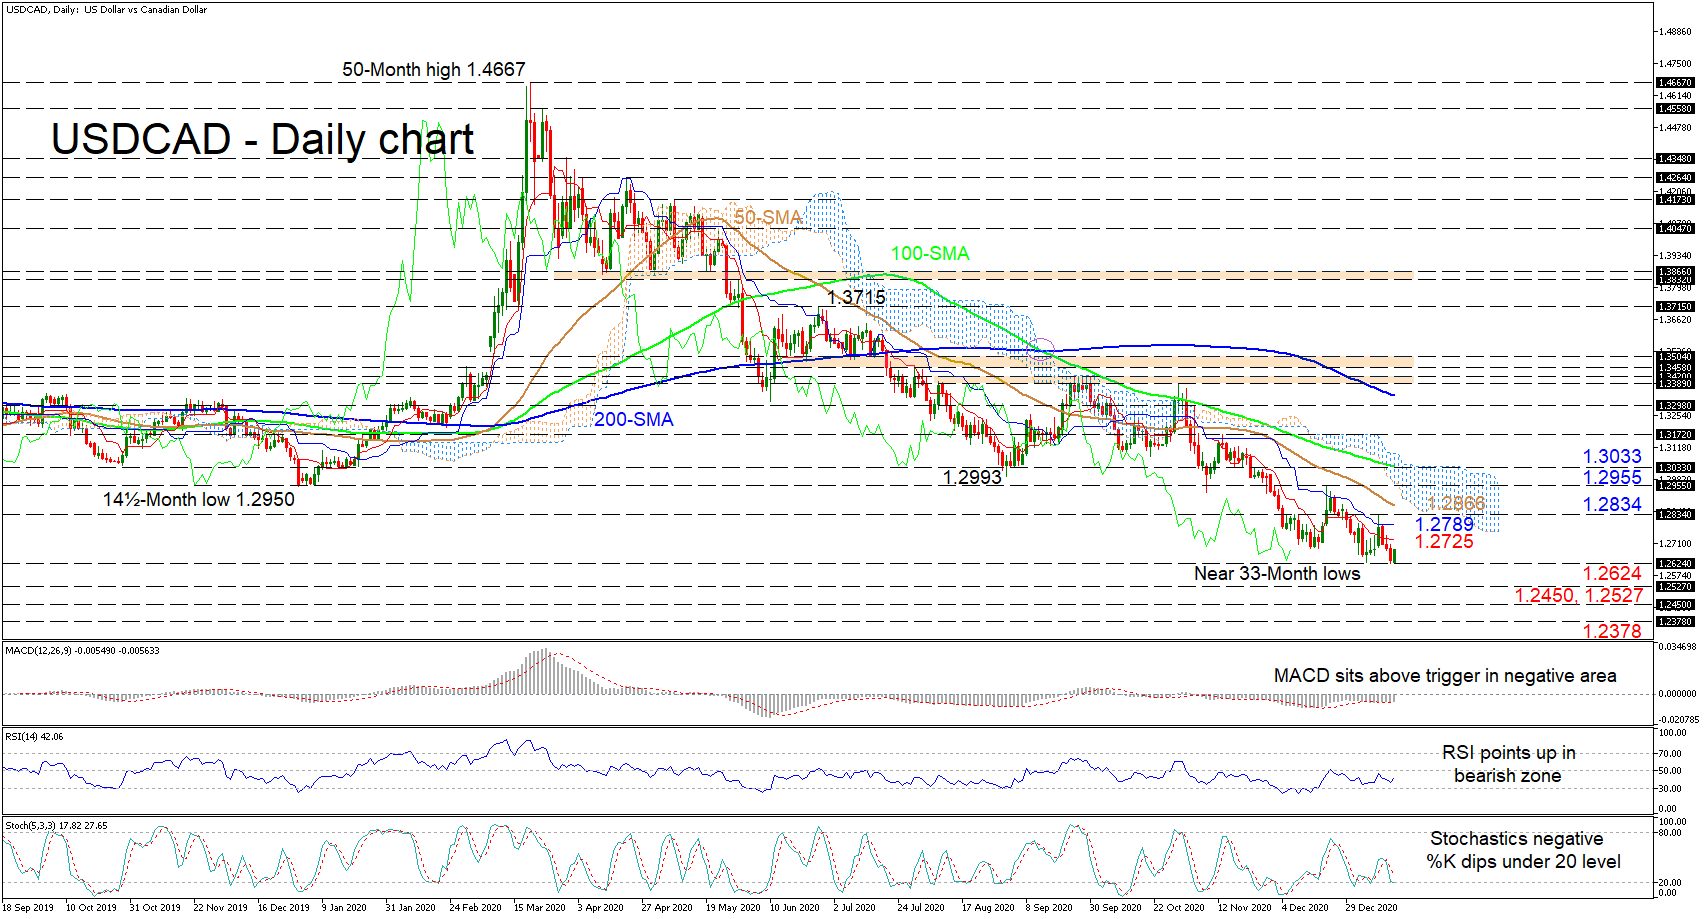
 USDCAD is pushing off multi-year lows but seems to be incapable of shaking off the bearish tone which has grasped the pair for nearly a year, starting back in March 2020. The Ichimoku line’s negative tempo has somewhat eased, while the diving simple moving averages (SMAs) are dictating the bearish picture.
Taking a glimpse at the short-term oscillators, we can observe a slight stalling in downwards momentum. The MACD, in the negative region, is resting on its red trigger line, while the RSI is pointing up in bearish territory. Yet, additional weakening in price is being reflected in the negatively charged stochastic oscillator and its %K line’s dip underneath the 20 mark.
If sellers resurface, initially they will need to slide under the immediate multi-year lows of 1.2624. Successfully diving under these near 33-month lows may see sellers target the respective troughs of 1.2527 and 1.2450, from April and February 2018. Should the plunge accelerate, the bears could target the 1.2378 barrier from January 2018.
In the event buying interest increases, the bulls may face early upside friction from the red Tenkan-sen line at 1.2725 and the blue-Kijun-sen line at 1.2789, ahead of the 1.2834 high. Stepping over this resistance, the 50-day SMA, looming overhead at 1.2866 could cap buyers’ attempts to challenge the Ichimoku cloud and the 1.2955 peak. Pushing higher into the cloud, the key 1.3033 obstacle could prove to be a heavy border, curbing advances in the pair.
Summarizing, USDCAD retains a steady downtrend below the 1.2834 mark and the SMAs. A shift above the cloud’s upper surface at 1.3033 may breathe some optimism into the pair, while a dip under 1.2624 may see further deterioration unfold.
Origin: XM


