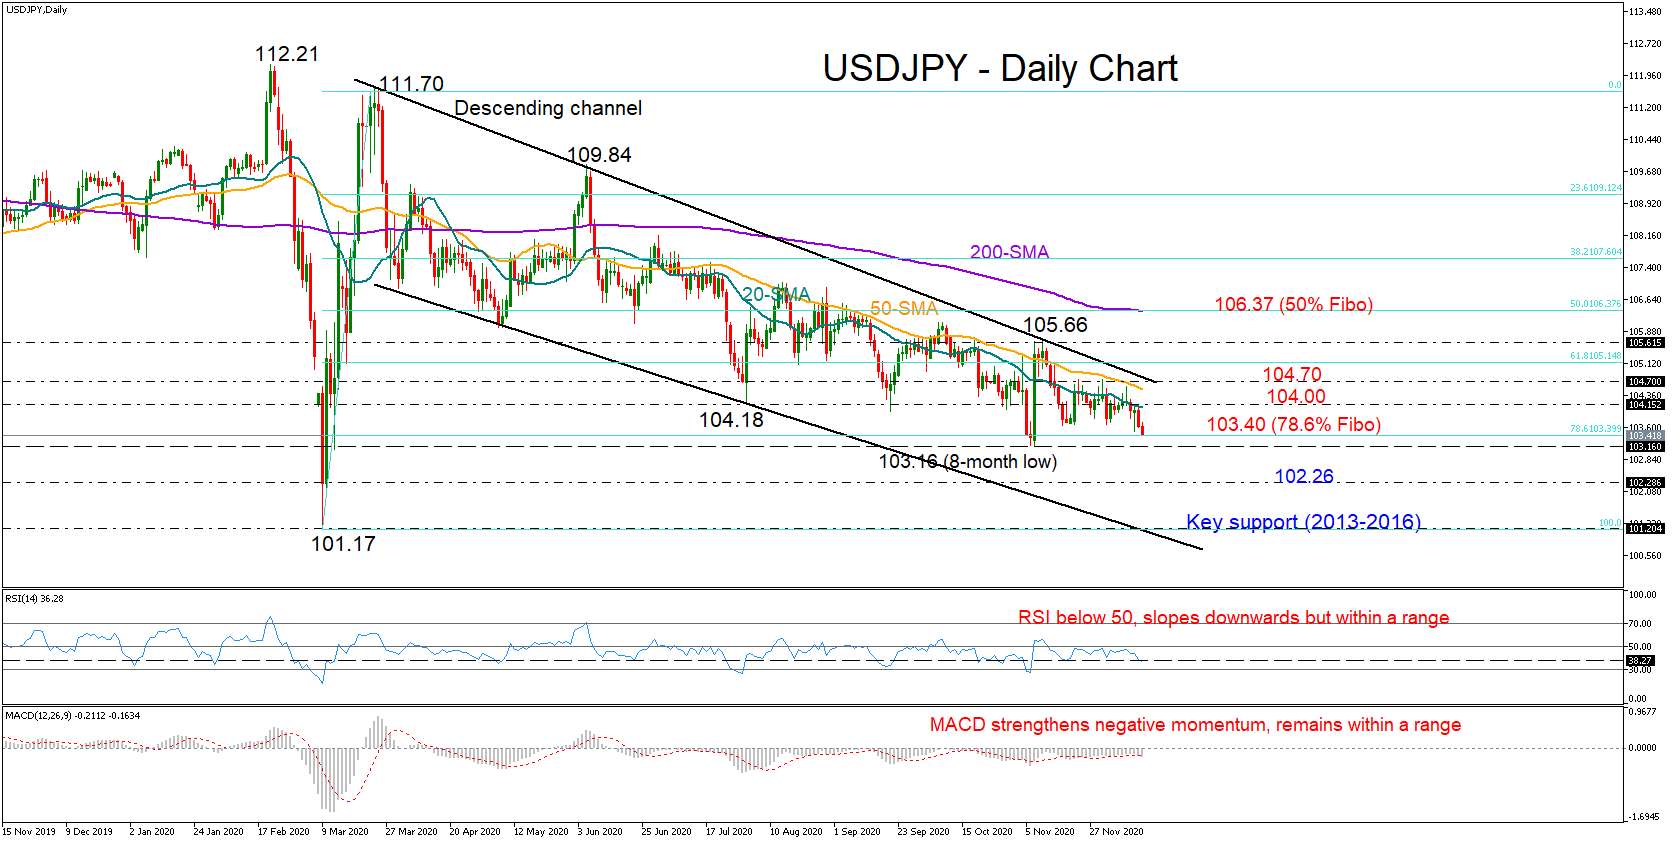
 USDJPY lost the battle with the 104.00 level and the 20-day simple moving average (SMA) on Tuesday, with the price sliding back into the 103.00 area and closer to the eight-month low of 103.16 registered in November.
Despite the pullback, the pair has not significantly violated the bottom of the 104.75 – 103.65 range area nor the 78.6% Fibonacci of the 101.17 – 111.70 upleg. Also, the RSI and the MACD, although within their bearish zones, keep fluctuating between familiar borders, questioning the continuation of the selling pressure for now.
The bears could gain full control below the 103.16 floor, likely strengthening the existing downward pattern within the nine-month old descending channel towards the key 102.26 support region. Moving lower, the price may test the 101.17 trough at the bottom of the channel.
Alternatively, a close above the 104.00 level and the 20-day SMA may help the pair to reach the 50-day SMA and the upper surface of the channel seen around 104.70. Running above that roof and breaching the 105.00 number, the door would open for the November peak of 105.66, and then for the 200-day SMA currently flattening around the 50% Fibonacci of 106.37.
Summarizing, the short-term bias remains neutral-to-bearish for USDJPY despite Tuesday’s decline. A drop below the 103.16 low could generate sharper losses, while an upturn above the ascending channel may shift the bias to positive.
Origin: XM