 USDJPY remains under pressure and risk is still to the downside as prices continue to drift lower from the 105.65 resistance. However, the pair is finding strong support around the 103.68 level. The short-term technical indicators are flattening and point to more weakness in the market.
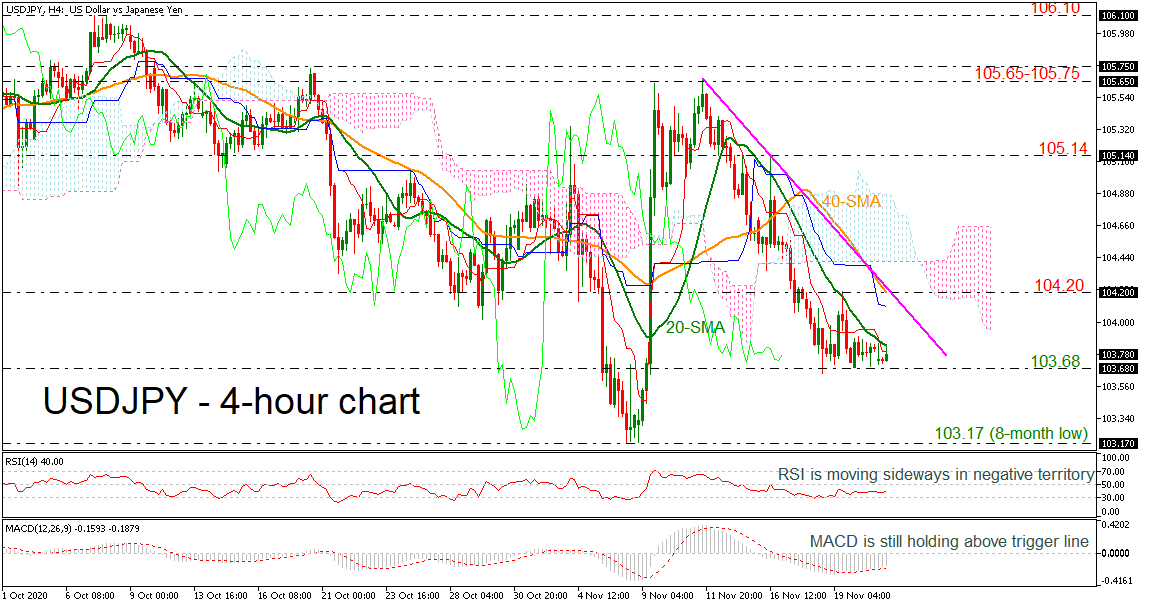
Looking at the 4-hour chart, prices are looking capped by the 20-period simple moving average (SMA) and the red Tenkan-sen line which are negatively aligned. The RSI indicator is holding in the negative region with weak momentum, while the MACD is hovering above the trigger line but below the zero level.
The next immediate target is the low at 103.68. At this stage the market would likely see a resumption of the downtrend and put in place a lower low at 103.17, which is an eight-month low. More losses could see the 101.15 support, registered on March 9.
Upside moves are likely to find resistance at 104.20, hitting the short-term falling line and the 40-period SMA. There is an important resistance zone between the lower and the upper surfaces of the Ichimoku cloud within 104.40-104.80. Rising above this area would help shift the focus to the upside towards 105.14. Breaking this level could see a re-test of 105.65-105.75.
In the medium-term, the bearish phase remains in play especially if prices continue to trade below 106.50.
Origin: XM