


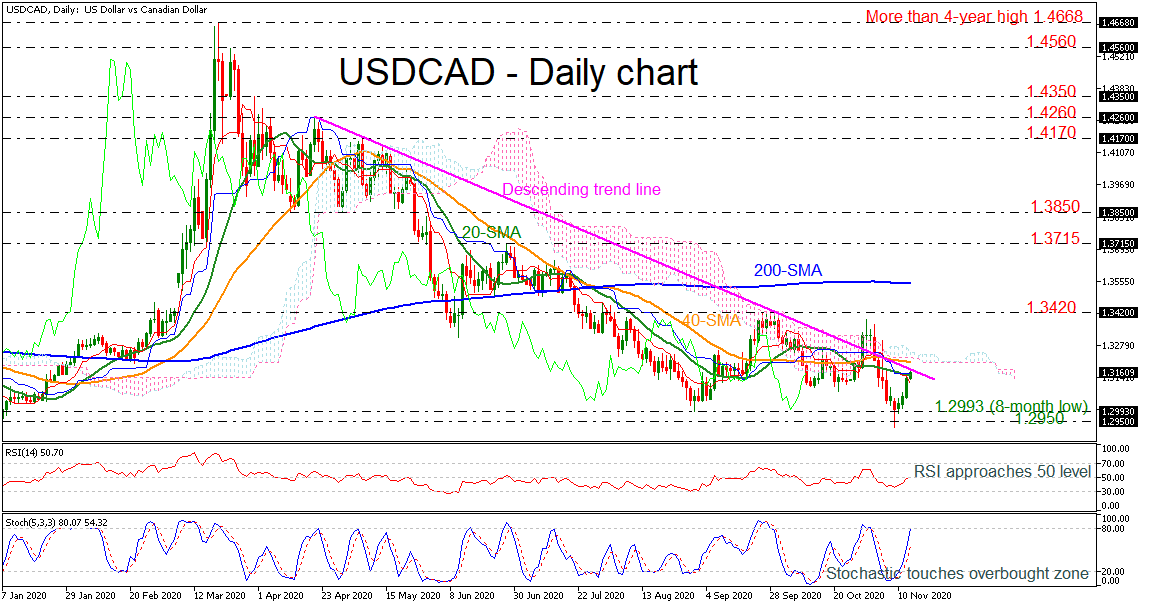
 USDCAD is touching the falling trend line, which has been developing since April 21, despite the break to the upside at the end of October. The price is also flirting with the 20-day simple moving average (SMA) and the momentum indicators are confirming the upside bias. The RSI is heading towards the positive region, while the stochastic is approaching the overbought area.
An extension above the descending line could find immediate resistance at the 40-day SMA and the lower surface of the Ichimoku cloud around 1.3200. An upside attempt could drive the market until the 1.3420 resistance before meeting the 200-day SMA currently at 1.3547. Even higher, the 1.3715 and the 1.3850 barriers are waiting the bulls.
On the other side, a failure of the upside move could take the price lower towards the eight-month low of 1.2993 before resting near 1.2950. Steeper declines could send the bears to the September 2018 low at 1.2780.
To conclude, USDCAD is still in a negative direction in the long-term, however, it seems quite positive over the last few sessions. Only a jump above the 200-day SMA could switch the bias to neutral.
Origin: XM


