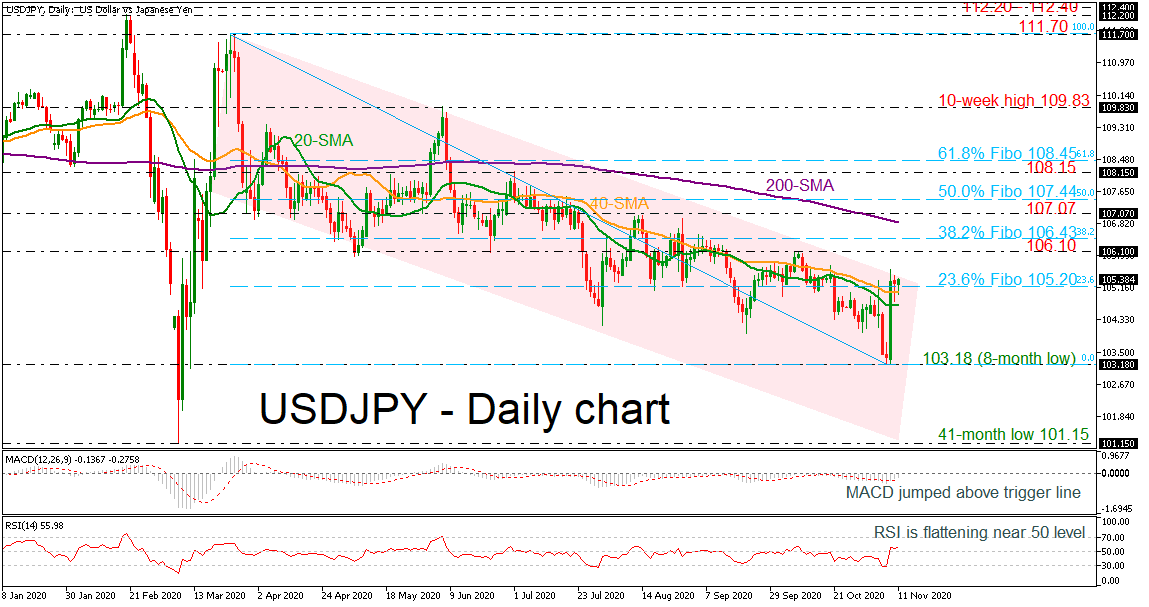
 USDJPY is developing slightly above the 23.6% Fibonacci retracement level of the down leg from 111.70 to 103.18 at 105.20 after the sharp buying interest from the new eight-month trough of 103.18, achieved on November 6. The price touched the upper boundary of the long-term descending channel, while a jump above it would shift the bearish structure to neutral.
According to technical indicators, the MACD jumped above its trigger line in the negative territory, while the RSI is pointing marginally up around the 50 level.
An increase above the channel could open the way for the 106.10 resistance ahead of the 38.2% Fibonacci of 106.43. Above that, the 200-day simple moving average (SMA) at 106.85 and the 107.07 lines could come in the spotlight before flirting with the 50.0% Fibonacci of 107.44.
However, a pullback could send the market lower again towards the eight-month low of 103.18, but first the price needs to overcome the 20- and 40-day SMAs. Even lower, the next support could come from the 41-month bottom on 101.15.
To sum up, USDJPY has been in a downward sloping channel and any advances above the 61.8% Fibonacci of 108.45 could change this outlook to neutral.
Origin: XM