


 USDCAD flipped last week’s gains after the rejection near 1.3389, diving back below its shorter-term simple moving averages (SMAs) and towards the key support of 1.3040, last seen in early September.
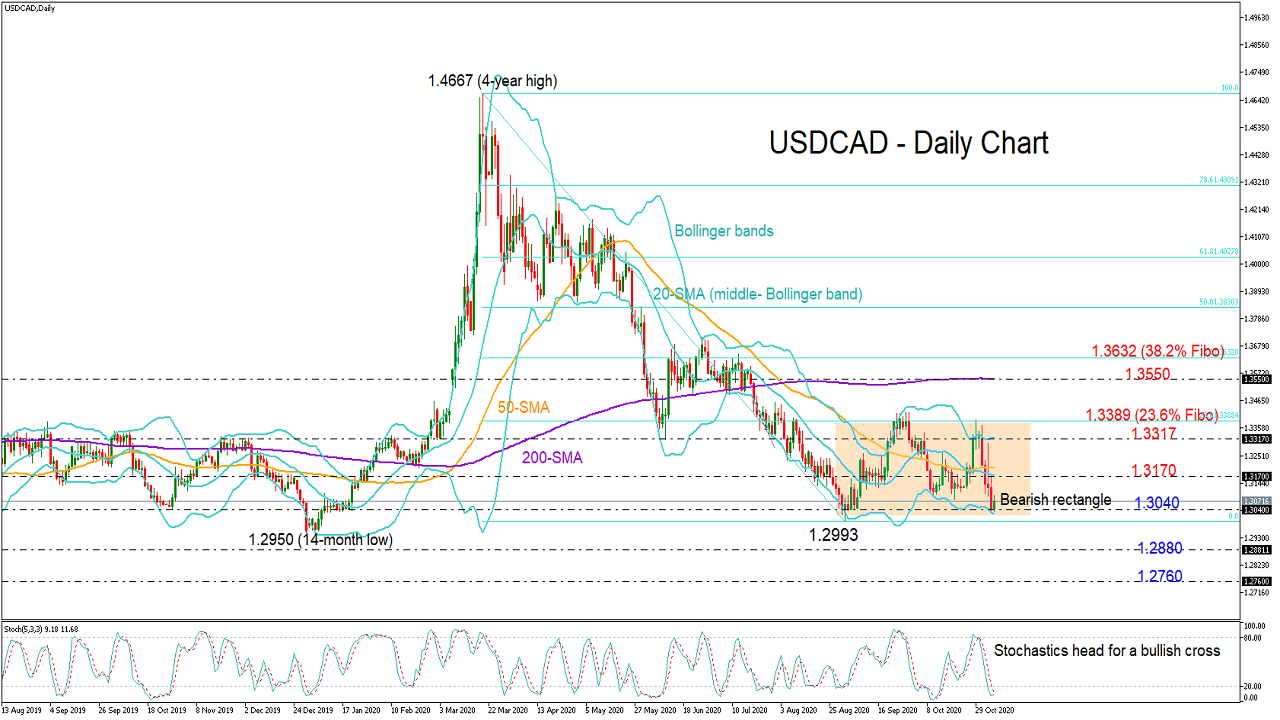
The lower Bollinger band is also restraining the price around that border, marking the location a potential turning point as the Stochastics head for a bullish cross below their 20 oversold level. It is also worthy to note that the sideways move between the 1.3389 and 1.3040 boundaries could be a bearish rectangle and therefore a signal that the negative trend from the 1.4667 peak may continue after a pause.
Should the bearish action indeed fade, the price may attempt to climb above its 20- and 50-day SMAs currently within the 1.3170 – 1.3200 area. A successful move higher could then stretch towards the upper Bollinger band at 1.3317 and the 1.3389 ceiling, where the 23.6% Fibonacci of the 1.4667 – 1.2993 is also placed. More notably, new buyers could enter the market if the pair manages to switch its short-term status from neutral to positive above 1.3389. In this case resistance may run up to the 200-day SMA at 1.3550 and the 38.2% Fibonacci of 1.3632.
On the downside, the outlook would deteriorate both in the short- and the medium-term if the 1.3040 border collapses, letting the price to decelerate towards 1.2880 and then down to 1.2760, both being key barriers during 2018.
In brief, USCDCAD could rebound at the bottom of a rectangle, though unless the price pierces that box on the upside, the formation will remain a negative trend continuation pattern.
Origin: XM


