


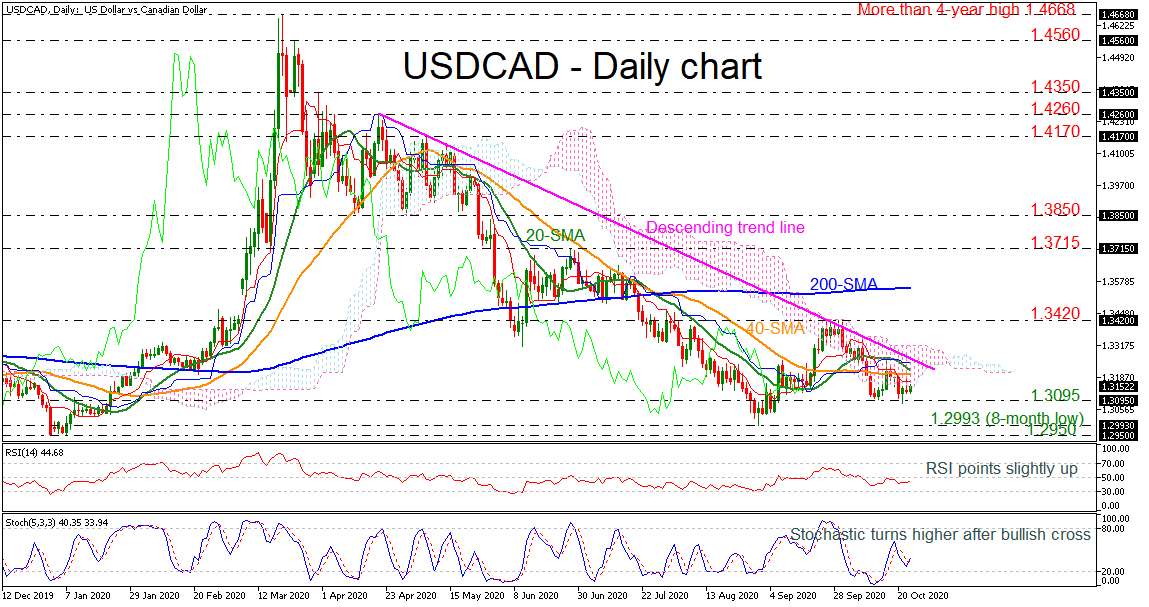
 USDCAD is continuing its downside movement in the longer timeframe after it found resistance around the 1.3420 barrier and the upper surface of the Ichimoku cloud once again. In the very short-term, the pair has been developing in a horizontal trajectory over the last couple of weeks, trading below the 20- and 40-day simple moving average (SMA).
In the technical picture, the RSI indicator is pointing slightly higher, while the stochastic is heading north after the bullish cross within the %K and %D lines. Both are indicating a possible upside move in the near term.
However, the SMAs and the Ichimoku cloud are acting as significant resistance levels. So, only a jump above the descending trend line may switch the bigger view to neutral-to-bullish, touching the 1.3420 barrier and the 200-day SMA currently at 1.3550.
In the case that the bears still have the upper hand, immediate support would come from the 1.3095 hurdle, before meeting the eight-month low of 1.2993 ahead of 1.2950.
In conclusion, USDCAD is endorsing the negative structure despite the contradicting signals in the momentum indicators.
Origin: XM


