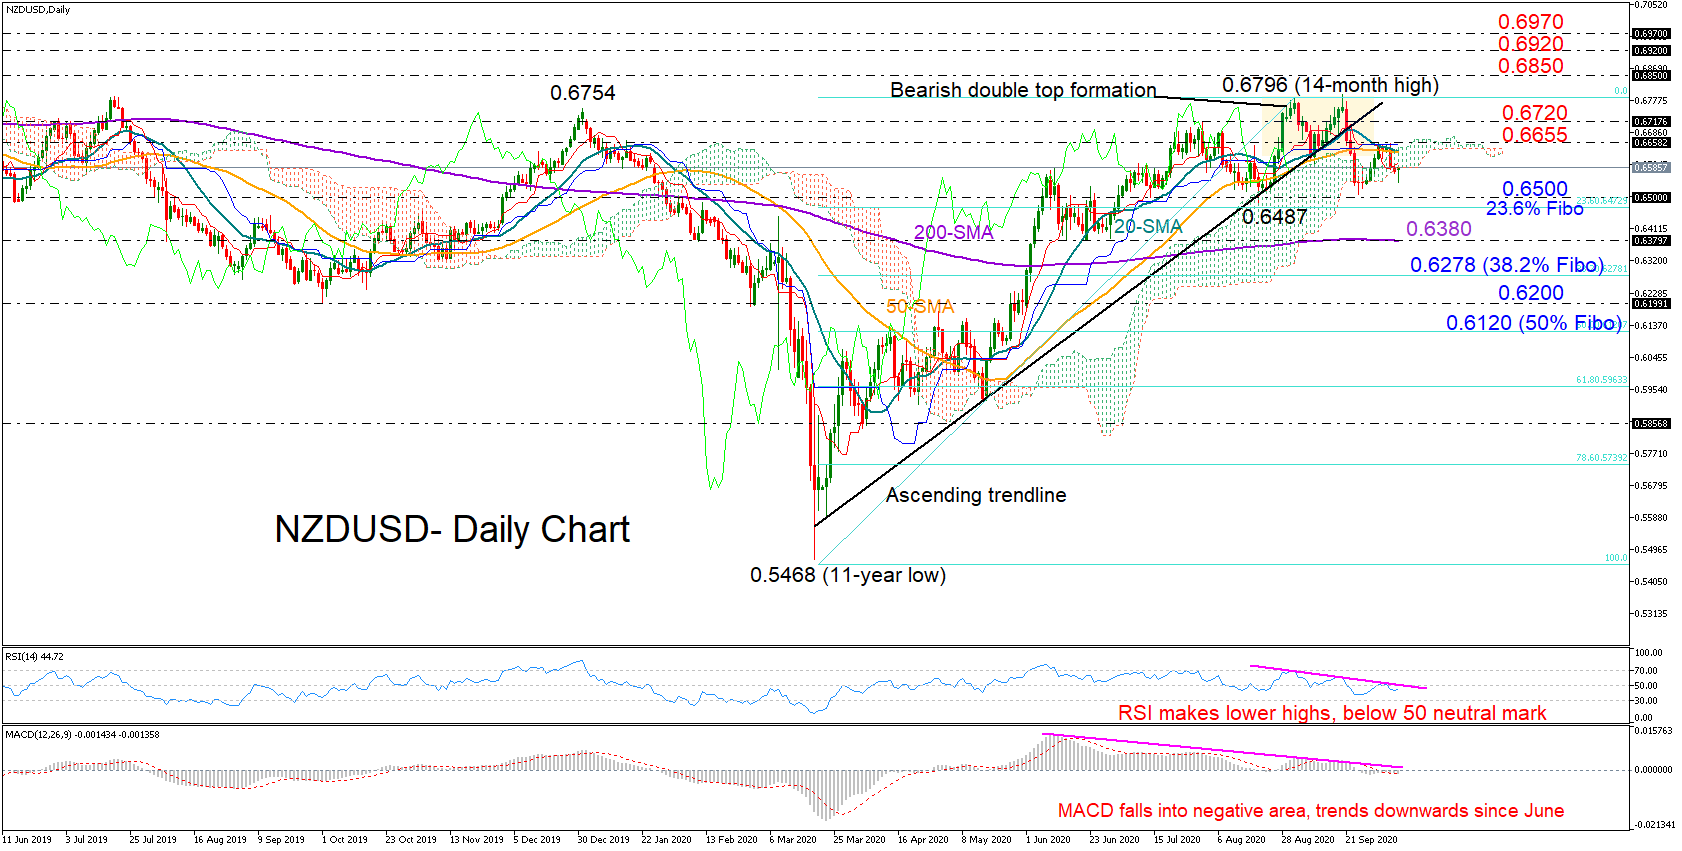
 NZDUSD could not sustain strength above 0.6600 as the 20- and 50-day simple moving averages (SMAs) and the blue Kijun-sen line blocked the way towards the 0.6796 peak, with the price registering a lower high in the daily chart instead. Note that the latter is following the creation of a bearish double top pattern.
A forceful close below 0.6500 would make the short-term outlook cloudier and the momentum indicators cannot exclude that scenario at the moment. The RSI, although still not far below its 50 neutral mark, is continuing to move below a descending trendline. Likewise, the MACD has been maintaining a downward direction since June and seems to be gaining negative momentum below zero.
Should the 0.6500 level give way, all eyes will turn to the 200-day SMA, which keeps flattening around 0.6380. The 38.2% Fibonacci of the March rally at 0.6278 could next garner attention if the selling pressure strengthens, while beneath that, the bears may get trapped between the 0.6200 support level and the 50% Fibonacci of 0.6120.
In the event the price successfully breaches the 0.6655 nearby resistance, some consolidation may commence around the 0.6720 former barrier. Then, the 0.6796 top will come under the spotlight, but the way higher could also be a rocky one as a cluster of obstacles within the 0.6850-0.6970 area may interrupt.
Meanwhile in the medium-term picture, a drop below 0.6500 would confirm a neutral outlook, while a rebound above the 0.6796 top would bring the bulls back into play.
In brief, NZDUSD remains exposed to downside corrections, keeping the risk of a down-trending market intact as well. A decisive step below 0.6500 would confirm the bearish bias, turning the medium-term outlook to neutral.
Origin: XM