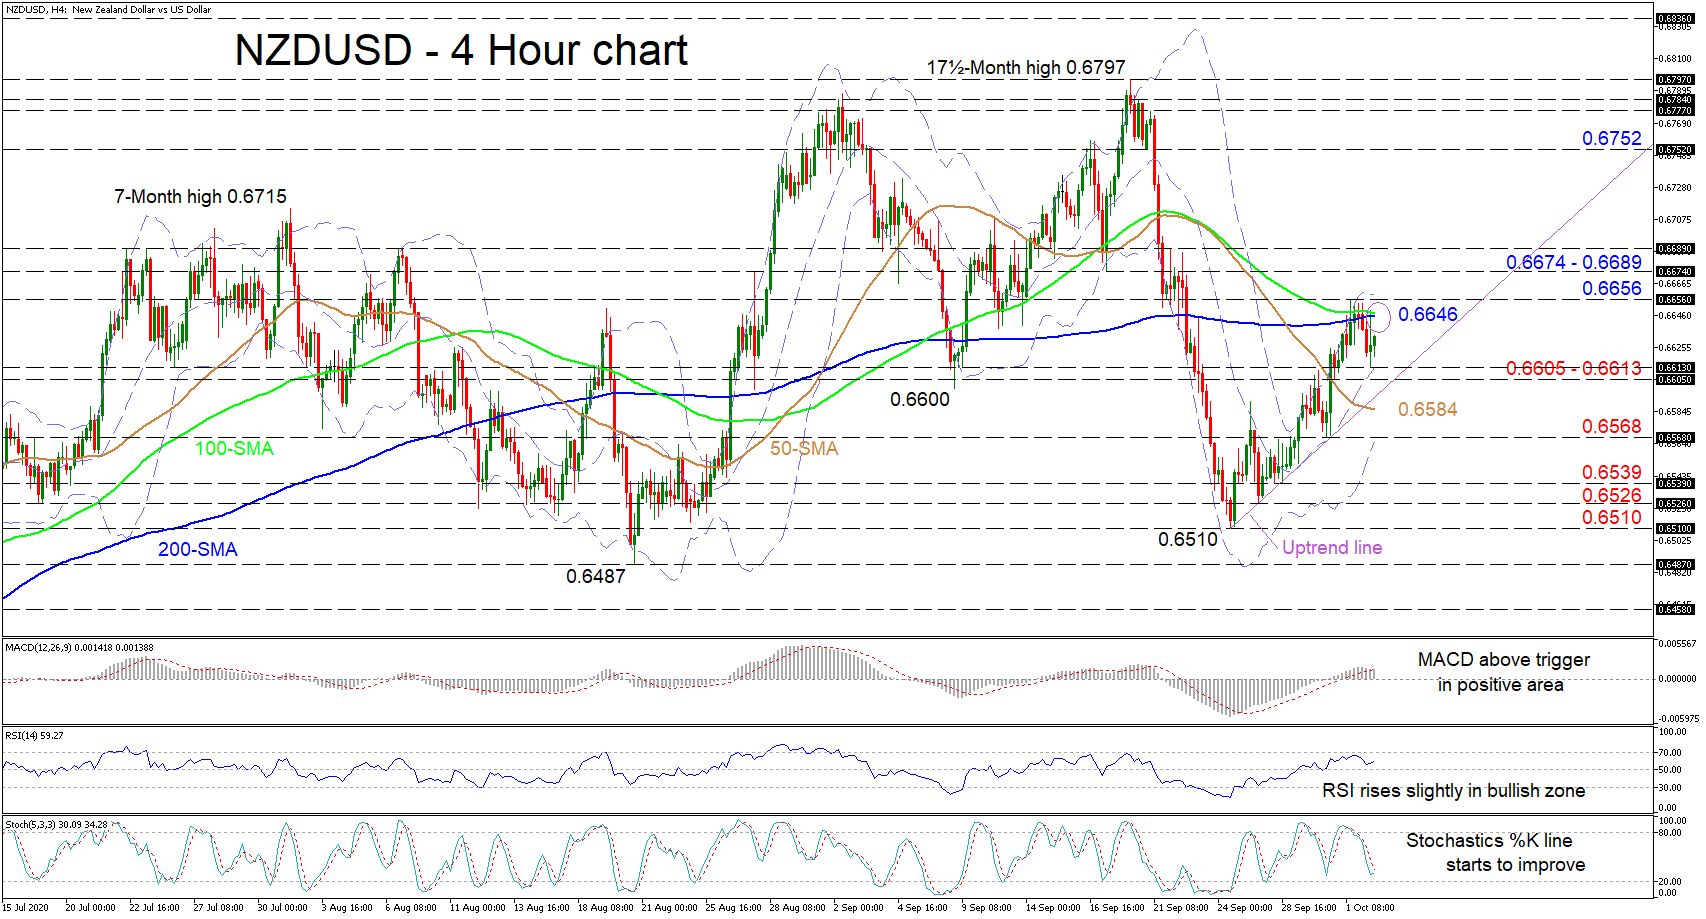
 NZDUSD found some traction on the mid-Bollinger band currently at 0.6613, after a pullback returned the pair underneath the 100- and 200-period simple moving averages (SMAs). Furthermore, the short-term ascent is holding above the uptrend line drawn from the 0.6510 mark.
The short-term oscillators suggest increasing momentum. The MACD, in the positive area, is above its red signal line, while the RSI is beginning to climb in bullish territory. The stochastic oscillators’ negative tone is waning as the %K line has started to turn upwards. In terms of the SMAs, the 50-period SMA maintains a weakening tone while the 100-and 200-period SMAs mould a horizontal direction, which may assist in nudging the pair towards the ascending line.
To the upside, heavy resistance may stem from the capping 100- and 200-period SMAs around 0.6646 and the 0.6656 high overhead, where the upper Bollinger band also resides. Surpassing this fortified zone, the price may jump to challenge the 0.6674 to 0.6689 hindering region. Triumphing above, the price may accelerate towards the 0.6752 inside swing low from September 21.
However, if selling interest intensifies, initial hardened support may arise from the section of 0.6605 to 0.6613, which includes the mid-Bollinger band and the uptrend line. Should the pair dive below the key rising diagonal line, the price may meet the 50-period SMA presently at 0.6584, before encountering the 0.6568 obstacle and adjacent lower Bollinger band. Steeper declines could extend towards the 0.6539 and 0.6526 troughs before eyeing the 0.6510 turning point.
Overall, as things stand, it appears that the pair may creep sideways towards the uptrend line before a clear course unfolds in the short-term timeframe.
Origin: XM