


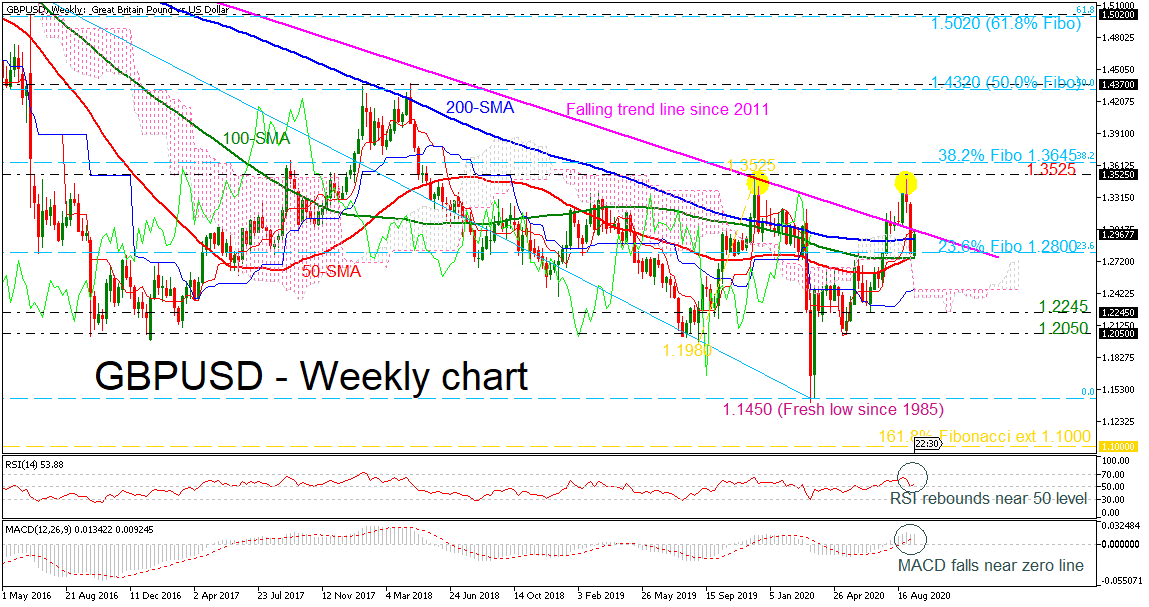
 GBPUSD is in the process of recouping some of the previous couple of weeks’ losses, finding support at the 100-weekly simple moving average (SMA) and the 50-weekly SMA. Moreover, the pair posted a double top at the 1.3525 resistance level, penetrating the descending trend line to the upside on August 23.
Technically, the RSI indicator is ticking north around the neutral threshold of 50 with weak momentum, while the MACD oscillator is slightly falling in the positive territory.
If the price successfully moves above the falling trend line again, which has been holding since 2011, it could hit the 1.3525 ahead of the 38.2% Fibonacci retracement level of the down leg from 1.7180 to 1.1985 at 1.3645. Moving higher, the next target could come from the 50.0% Fibonacci of 1.4320.
Alternatively, a decline beneath the SMAs and the 23.6% Fibonacci of 1.2800 could take the price until the upper surface of the Ichimoku cloud around 1.2460. More downside pressure could open the door for the 1.2245 and 1.2050 support levels.
Concluding, GBPUSD remains in a descending movement in the longer timeframe and if there is an upside rally above the double top of 1.3525, that could switch the outlook to neutral-to-bullish.
Origin: XM


