


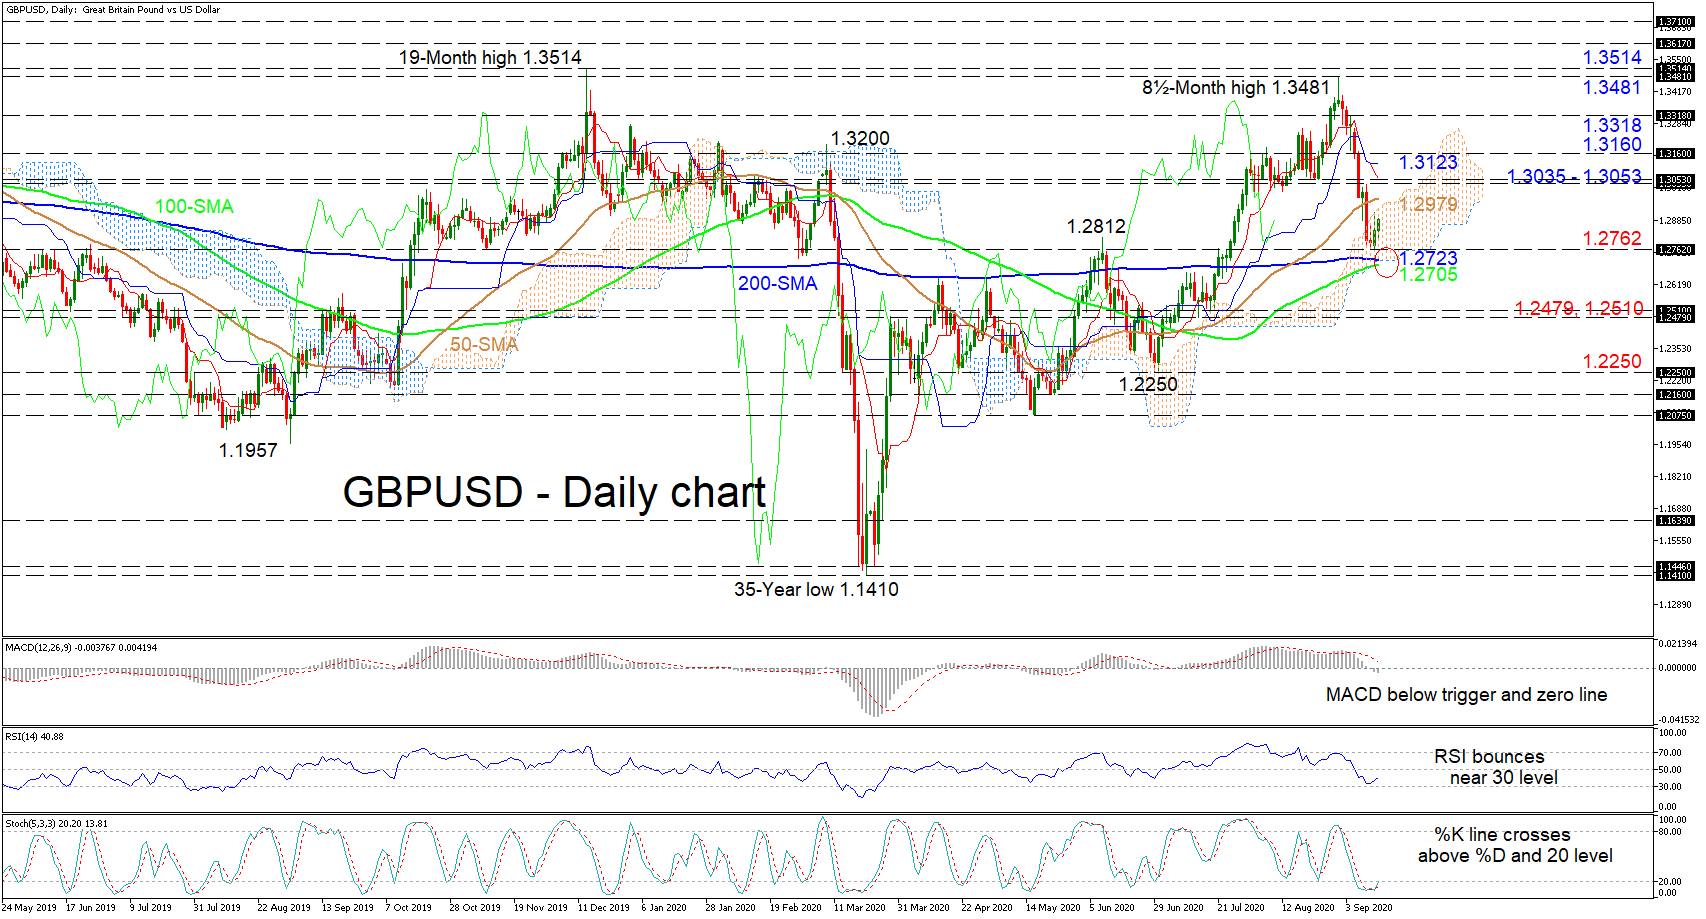
 GBPUSD has pivoted at the 1.2762 level within the Ichimoku cloud and near the 200-day simple moving average (SMA), disrupting the correction from the 8½-month peak of 1.3481. Aiding downside pressure is the falling red Tenkan-sen line, which has crossed under its blue-Kijun-sen line. The MACD, below its red trigger line is sponsoring negative price action as it dips further below the zero mark.
Nonetheless, the RSI’s rebound ahead of the 30 level suggests a pick-up in positive momentum. The stochastic %K line has positively overlapped the %D line and has confirmed a bullish tone. Moreover, the nearing bullish crossover of the 200-day SMA by the 100-day one may reinforce positive sentiment.
If buyers manage to dent the pullback, initial resistance may commence from the cloud’s upper surface and the nearby 50-day SMA at 1.2979. Slightly overhead, buyers may encounter a key resistance band of 1.3035 to 1.3053, coupled with the red Tenkan-sen line. Overrunning this, the blue Kijun-sen line at 1.3123 and the neighbouring 1.3160 barrier, may attempt to impede the price from testing the 1.3318 high. Should buying interest persist, the pair may target the 1.3481 and 1.3514 critical tops from September 1 and December 2019.
If sellers resurface, early support may develop from the 1.2762 low ahead of the crucial bullish cross zone of 1.2723 to 1.2705, which also includes the cloud’s lower boundary. Diving past this, the price may plunge for the congested obstacles of 1.2510 and 1.2479 respectively. Failing to dismiss the decline, the 1.2250 trough could next draw traders’ attention.
In brief, GBPUSD is facing conflicting signals. Yet, the bias could lean on the positive side should the price manage to hold above 1.2762 and the 200-day SMA at 1.2723.
Origin: XM
__________


