 USDCHF has glided into a sideways structure where upside moves have been capped by the 50-day simple moving average (SMA). The recent flattening out of the, and now fused Ichimoku lines backs the recent ranging in the pair, while all SMAs maintain their forged bearish tone.
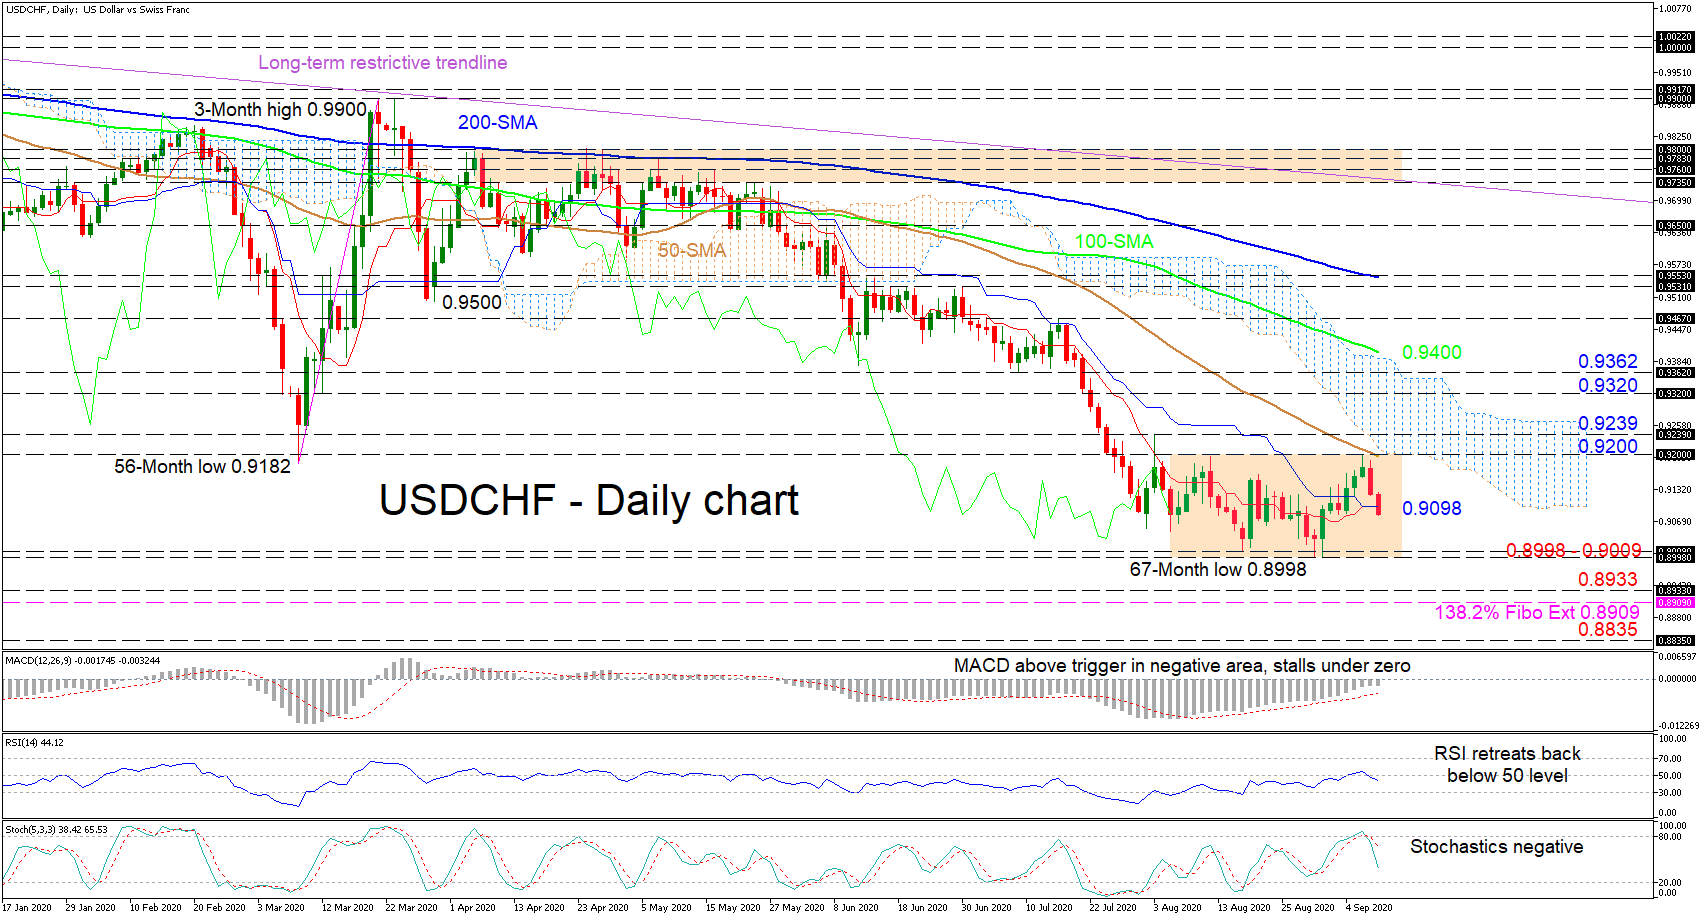
The short-term oscillators reflect the pause in the market but convey a pick-up in negative sentiment. The MACD, although having strengthened above its red signal line in the negative region, looks set to reclaim it, while the falling RSI recedes below its 50 threshold. Moreover, the declining stochastic lines endorse additional negative price action.
If sellers manage to steer under the Ichimoku lines at 0.9098, they could encounter initial support from the base of the ranging market of 0.9009 to 0.8998, the latter being a 67-month low. Losing further ground could meet the 0.8933 trough from back in January of 2015 before the price tests the neighbouring 0.8909 level, which is the 138.2% Fibonacci extension of the up leg from 0.9182 to 0.9900. Breaching this too, the pair may target the 0.8835 inside swing high achieved in February of 2015.
If buying interest intensifies, resistance may originate from the fortified ceiling of the very short-term directionless market at 0.9200, where the 50-day SMA and cloud’s lower boundary reside. Violating this roof, the 0.9239 high may try to prevent upside moves from stretching towards the 0.9320 and 0.9362 key barriers ahead of the 100-day SMA currently at 0.9400.
In brief, USDCHF’s very near-term picture seems to be ruled by a neutral pattern while a broader negative bias commands the bigger timeframes. A break either above 0.9200 or below 0.8998 could reveal the next direction.
Origin: XM