


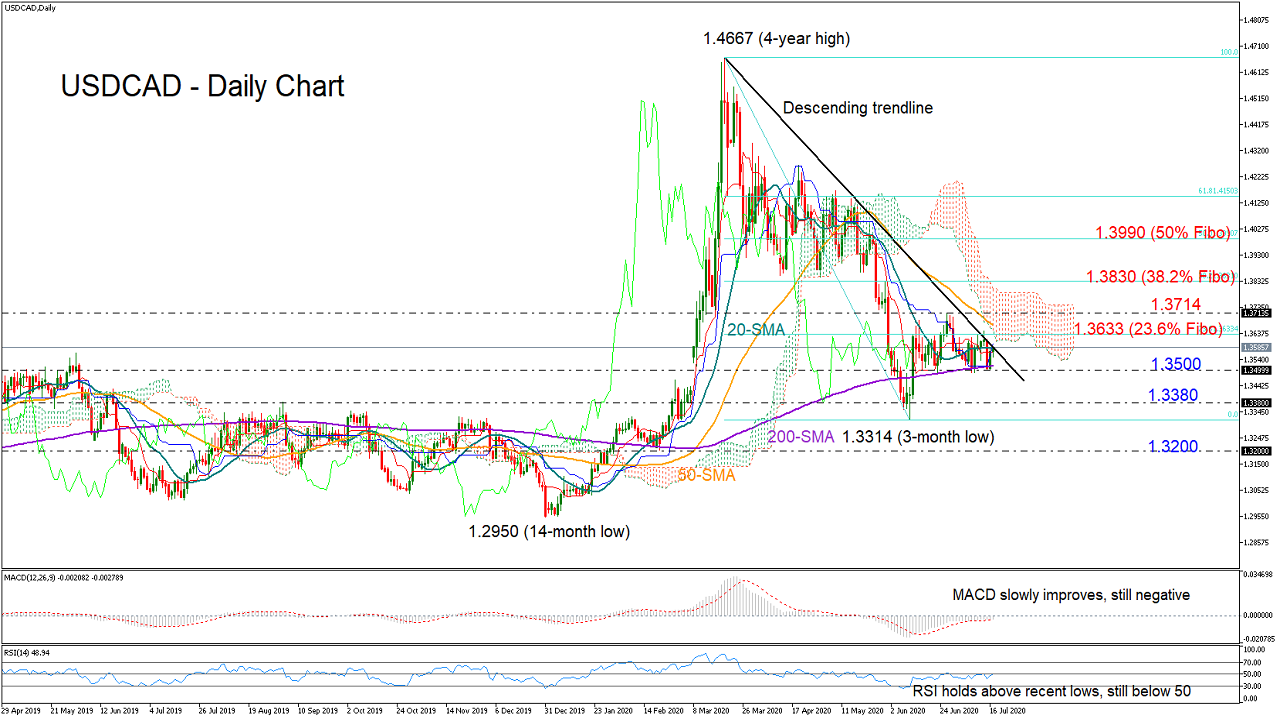
 The 200-day simple moving average (SMA) limited downside corrections in USDCAD, holding the pair above its recent lows. Still, positive movements were constrained too, as the descending trendline with the help of the 23.6% Fibonacci retracement of the 1.4667-1.3314 downleg managed to keep the bulls under control.
Currently, the momentum indicators are not very promising that the pair could record important green sessions in the short-term. The RSI continues to consolidate below its 50 neutral mark despite holding above its previous troughs, while the MACD is softly improving above its red signal line but has yet to enter the positive territory.
Hence, traders could wait for a clear break above the trendline and the 23.6% Fibo of 1.3633 to increase exposure towards the swing high of 1.3714. Above the latter, the 38.2% Fibonacci of 1.3830 could block the way towards the 50% Fibonacci of 1.3990.
In the negative scenario where the price retreats below the 200-day SMA and the 1.3500 number, the door would open for the 1.3380-1.3314 support area. Lower, the pair would re-activate its downward pattern started from the 1.4667 peak, with the 1.3200 number likely coming next to the rescue.
Meanwhile in the medium-term window, the market maintains a bearish structure and only a sustainable upside move above the previous high of 1.3715 could put the negative pattern in doubt.
Summarizing, USDCAD is holding a neutral-to-positive short-term bias. A decisive close above 1.3633 could bring the bulls back into play.
Origin: XM


