


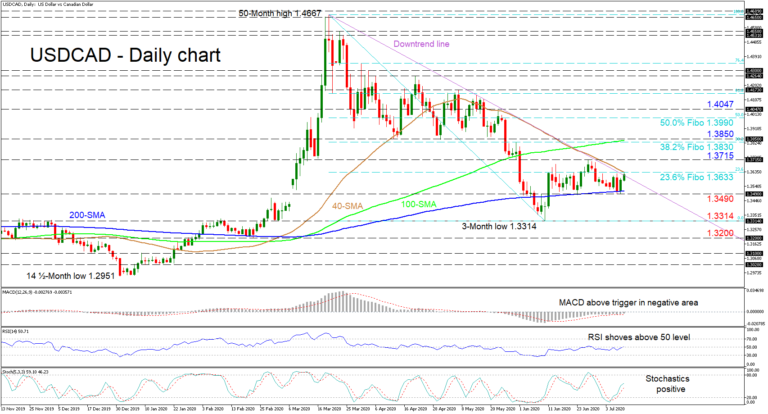
 USDCAD is currently tackling the downtrend line drawn from the 50-month high of 1.4667 achieved on March 19, aligned with the falling 40-day simple moving average (SMA). Further hindrance is arising from the overlapping 1.3633 level, that being the 23.6% Fibonacci retracement of the down leg from 1.4667 to 1.3314.
The bulls seem to have backing from the oscillators that reflect improving positive momentum in the near-term. The MACD, in the negative region, holds above its red trigger line near the zero mark, while the increasing RSI has crept above the 50 threshold. Moreover, the stochastic lines maintain a positive bearing with room to move towards the 80 level, thus endorsing advances. However, traders need to be aware of a nearing bearish crossover of the 200-day SMA that may enhance the negative picture.
To the upside, heavy limitations may emanate from the downtrend line and the immediate 23.6% Fibo of 1.3633, where the 40-day SMA is currently located. Conquering these crucial barriers may push the pair past the 1.3715 high, as it shoots for the key resistance area from the 38.2% Fibo of 1.3830 until the 1.3850 obstacle, which also encapsulates the 100-day SMA. Overrunning this too, the 50.0% Fibo of 1.3990 could come into focus ahead of the 1.4047 peak.
In the event the diagonal line denies gains, support may originate from the vital 200-day SMA situated marginally above the 1.3490 mark. Steeper declines may target the 1.3314 trough, with further loss of ground extending towards the 1.3200 handle.
In brief, a break below the 200-day SMA could see the negative outlook resume, while a break above the trendline may see the neutral demeanor upgrade to a bullish one in the short-term timeframe.
Origin: XM


