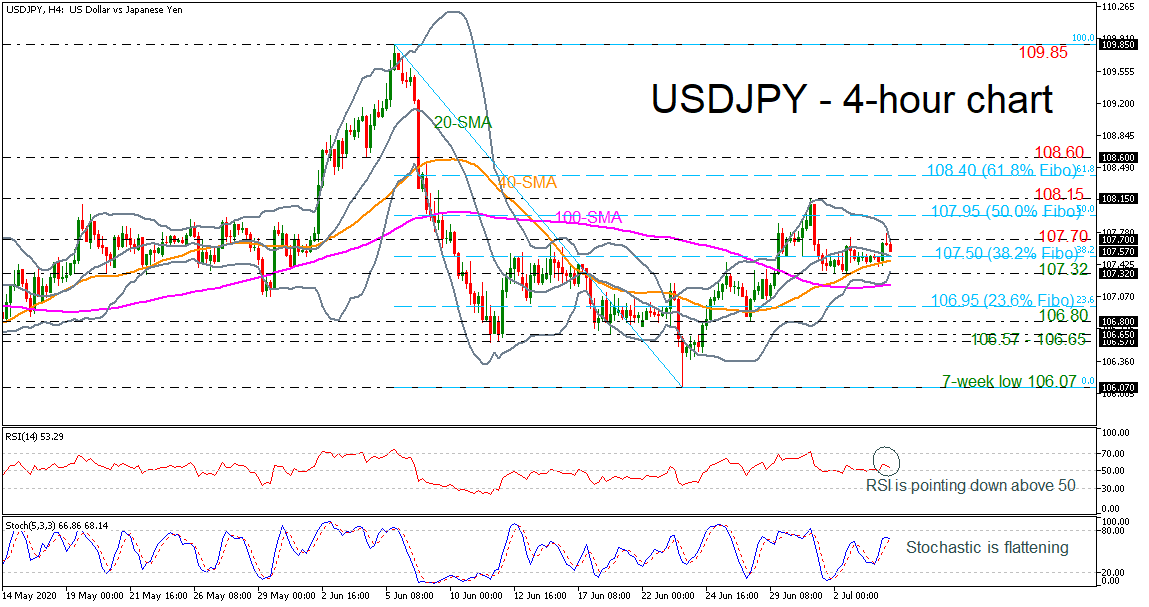
 USDJPY is consolidating within tight Bollinger bands that are suggesting a potential sharp move either to the upside or to the downside. The price remains above the short-term moving averages; however, they are pointing down. The RSI indicator is heading south or into the bullish territory, while the stochastic is moving sideways below the overbought zone.
If the price successfully slips beneath the 38.2% Fibonacci retracement level of the down leg from 109.85 to 106.07 at 107.50, it could meet the 107.32 support, which overlaps with the lower Bollinger band. Breaching this level, the 100-period simple moving average (SMA) could come into spotlight at 107.20 ahead of the 23.6% Fibonacci of 106.95. Even lower, the price could open the door for the 106.80 support.
Alternatively, a jump above the upper Bollinger band and the 107.70 resistance could pause the move at the 50.0% Fibonacci of 107.95. Slightly above this hurdle, the price could rest near the 108.15 barrier, identified by the latest peak, before resting at the 61.8% Fibonacci of 108.40.
Summarizing, USDJPY has been in a neutral move since the beginning of the month with a mid-level in the 107.50 region. However, in the bigger picture, the pair is moving higher after the bounce off the seven-week low of 106.07.
Origin: XM