


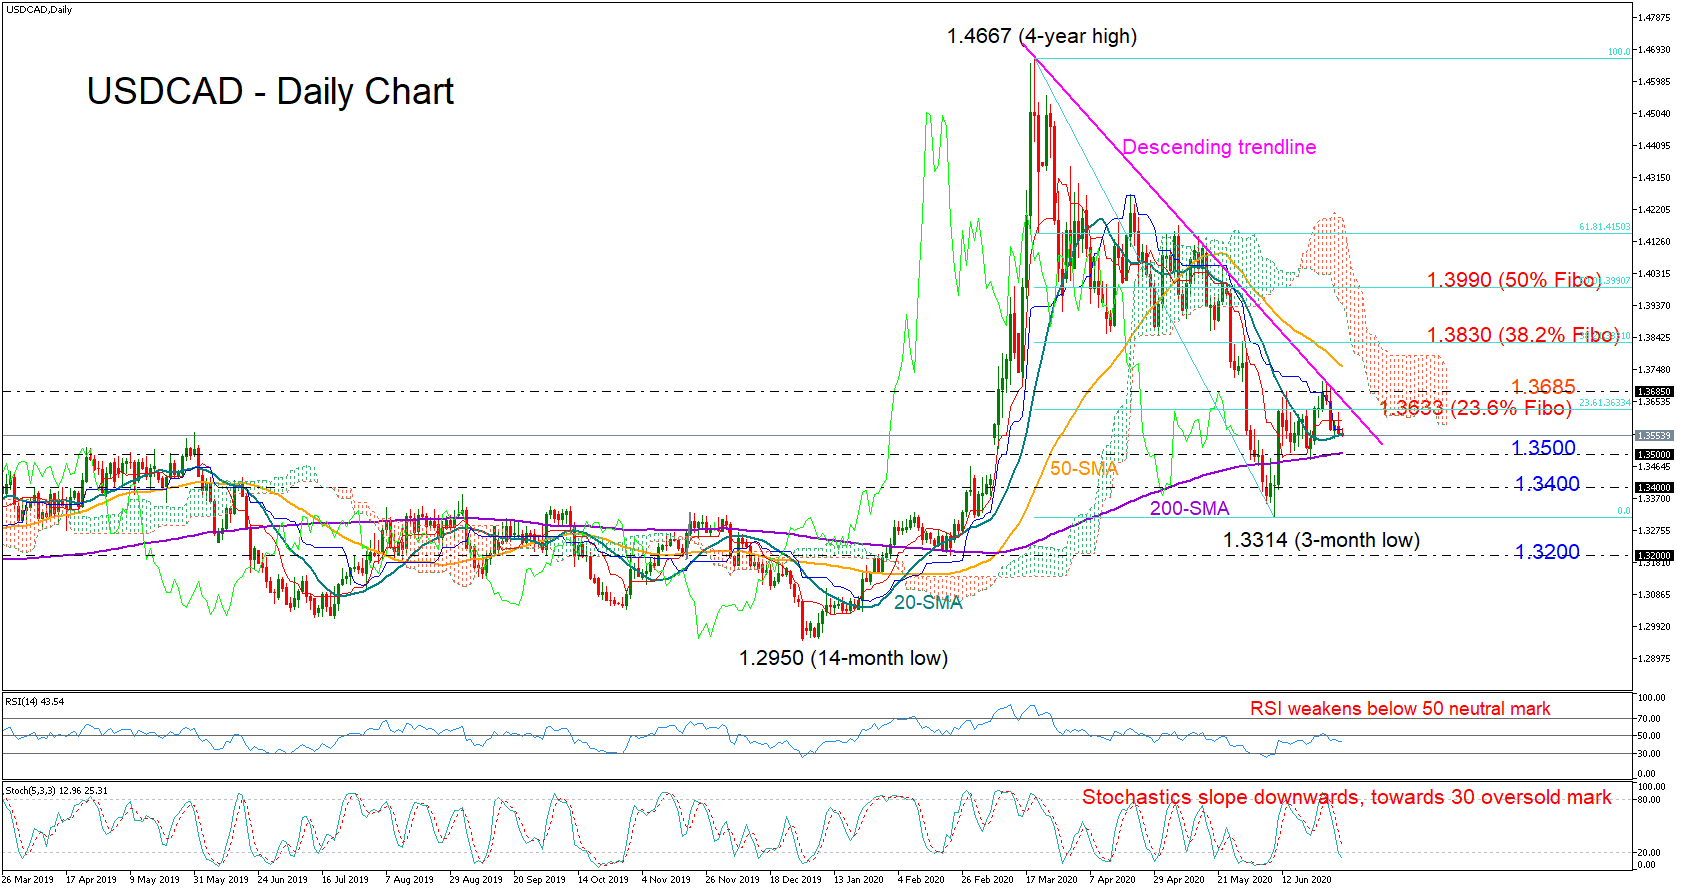
 USDCAD bulls faded out near the descending trendline stretched from the top of 1.4667 in the last days of June, with the price slipping back to the 1.3500 zone.
The downside correction, however, has not yet disturbed the short sequence of higher highs and higher lows started from the 1.3314 bottom. And should support around 1.3500 hold with the help of the 20- and 200-day simple moving averages (SMAs) in the same neighborhood, the pair may push harder to clear the trendline. If a successful break at this point happens, with the price closing comfortably above 1.3685 too, the bulls could pick up steam towards the former key support area of 1.3830, which is also coinciding with the 38.2% Fibonacci of the downleg from 1.4667 to 1.3314. Higher, the door would open for the 50% Fibonacci of 1.3990.
Nevertheless, the basic scenario remains discouraging given the falling RSI and the weakness in the Stochastics and unless the 200-day SMA manages to curb the selling pressure, more losses could follow until the 1.3400 level. If the bears persist, the 3-month low of 1.3314 could next come under the spotlight ahead of the 1.3200 round number.
Summarizing, USDCAD continues to hold a bearish short-term bias after the latest pullback, though it remains to be seen if the nearby SMAs can come to the rescue.
Origin: XM


