


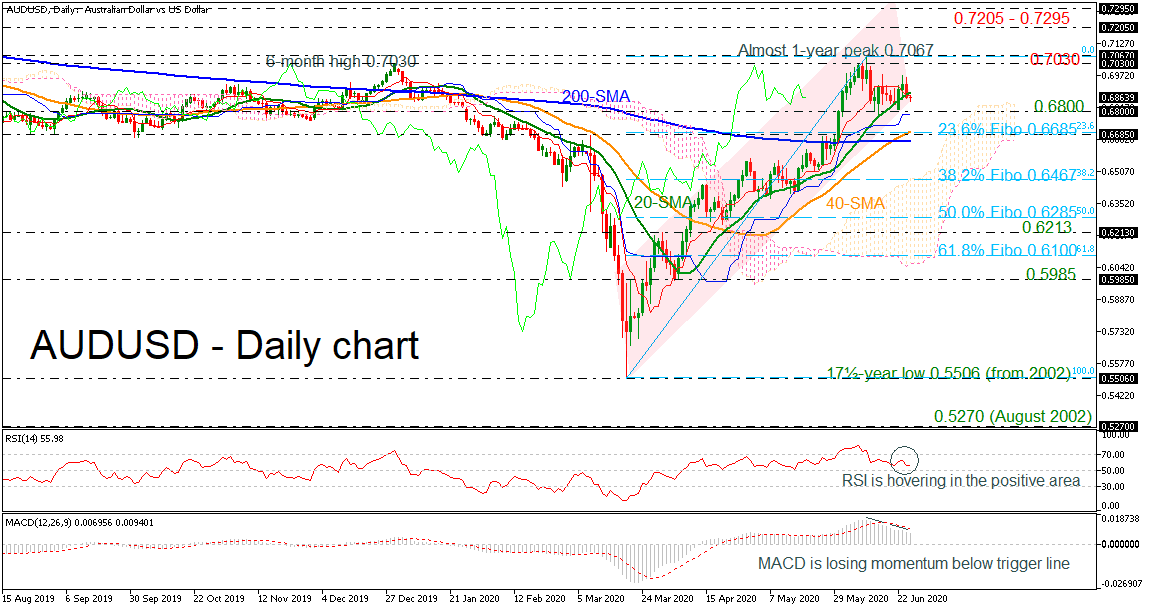
 AUDUSD has been advancing over the last three months, peaking near the almost one-year high of 0.7067. The bullish rally extended its move above the simple moving averages (SMAs). However, the RSI in the positive region is flattening and the MACD is losing momentum below its trigger line but it remains in the bullish zone. Moreover, the red Tenkan-sen line stands above the blue Kijun-sen line suggesting a continuation of the upside move. Note, that the indicators are in a contradiction as the price has been moving sideways over the last week.
If sellers sink the price below the 20-day SMA, immediate support is coming from the 0.6800 psychological mark and the 23.6% Fibonacci retracement level of the up leg from 0.5506 to 0.7067 at 0.6685, which overlaps with the 40-day SMA. Marginally below this line, the 200-day SMA could act as a crucial barrier for the bears around 0.6653. Breaching this level, the 38.2% Fibonacci of 0.6467 could attract attention.
On the other hand, a move higher could touch the 0.7030 resistance and the almost one-year high of 0.7067. Above that, the 0.7205 barrier, identified by April 14 and the 0.7295 obstacle registered on January 2019, could pause the upside structure in the medium-term timeframe.
Summarizing, AUDUSD has been in a bullish channel in the near term and only a close beneath the 0.6100 handle could shift the outlook to neutral and then to bearish.
Origin: XM


