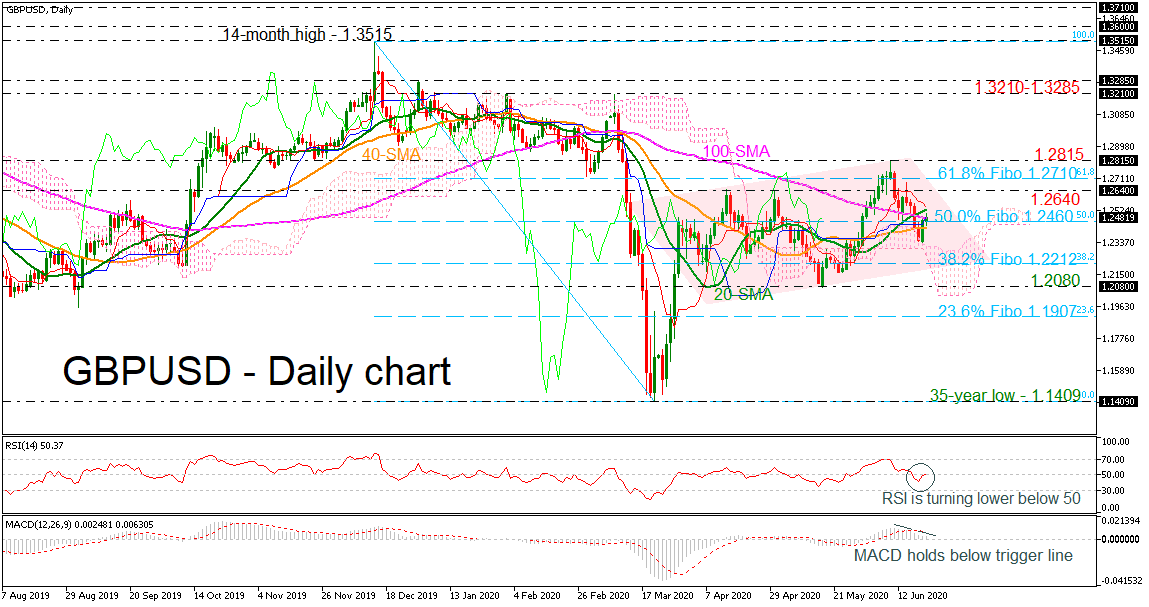
 GBPUSD has been developing within an ascending channel over the last three months, hovering around the moving averages in the daily timeframe. The price started an upward move following the rebound on the 35-year low of 1.1409, remaining above the Ichimoku cloud, while the RSI is moving sideways near the 50 area. However, the MACD oscillator is heading south below its trigger line, confirming the recent downside movement.
Should the market extend losses below the 50.0% Fibonacci retracement level of the down leg from 1.3515 to 1.1409 at 1.2460, prices could slide towards the 38.2% Fibo of 1.2212. A significant leg below this area could hit the 1.2080 support which currently stands slightly above the lower surface of the Ichimoku cloud before the market retests the 23.6% Fibonacci of 1.1907, switching the outlook to neutral.
On the flip side, if the pair surpasses the 20- and 100-day simple moving averages (SMAs), immediate resistance could be met at the 1.2640 barrier. Steeper increases, though, could drive GBPUSD north towards the 61.8% Fibo of 1.2710 and 1.2815. Above that, the bullish bias could revive the recent uptrend and make a move towards the 1.3210-1.3285 area, taken from the highs in March and December.
Concluding, GBPUSD is looking bullish in the short-term and any daily close above 1.2815 could open the door for more gains in the medium-term timeframe as well.
Origin: XM