 USDJPY has settled at the Ichimoku cloud’s upper surface after pivoting from a produced low of 106.57 near the bottom band of the cloud. The recent surge was neutralised, returning the pair back below the simple moving averages (SMAs) and around the 107.25 mark.
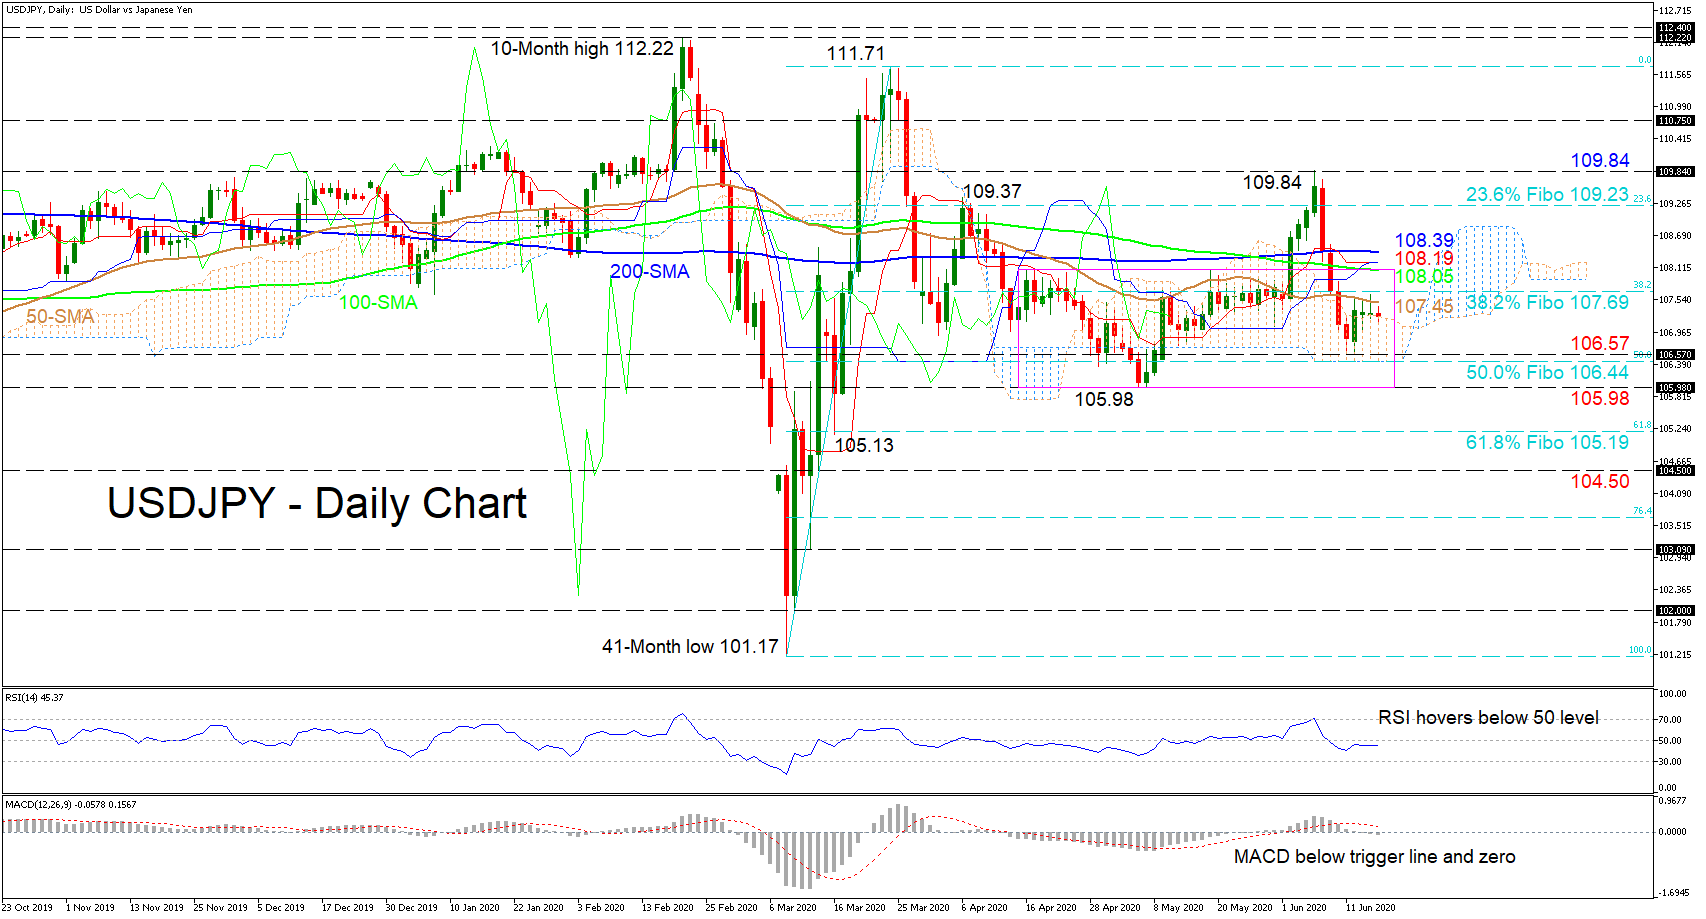
The horizontal 100- and 200-day SMAs and the flattened Ichimoku lines reflect the directionless market that has now extended for roughly two months. Furthermore, the short-term oscillators also display a state of evaporated momentum. The MACD, below its red signal line has slipped under zero, while the RSI is hovering beneath its neutral threshold.
Should the 50-day SMA continue to cap upside tendencies and drive the price into the cloud, tough support could emerge from the 106.57 low to the nearby bottom of the cloud at the 106.44 level. The latter happens to be the 50.0% Fibonacci retracement of the up leg from the 41-month low of 101.17 to the 111.71 high, and if sellers endure, the key 105.98 trough may attempt to apply the brakes. If price loses further ground, it could extend the pair towards the 61.8% Fibo of 105.19 near the trough of 105.13.
To the upside, immediate resistance could occur from the 50-day SMA at 107.45 and the 38.2% Fibo of 107.69. Moving higher, the area from the 100-day SMA of 108.05 until the 200-day SMA at 108.39, which includes the Ichimoku lines at 108.19, could provide additional constraints. Overrunning these borders, the price may shoot for the 23.6% Fibo of 109.23 before meeting the 109.84 peak.
All in all, USDJPY remains in a neutral phase, and a break above the 109.84 peak or below the 105.98 trough could ignite the next clear direction in the short-term timeframe.
Origin: XM