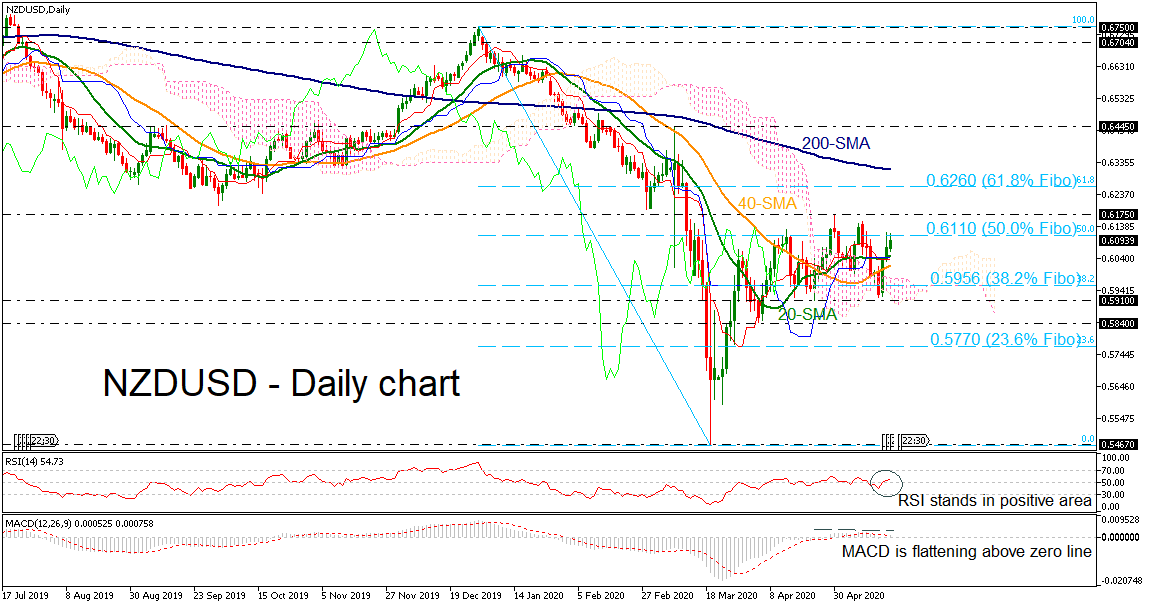
 NZDUSD has been on the sidelines over the last six weeks with a strong resistance level at the 50.0% Fibonacci retracement level of the down leg from 0.6750 to 0.5476 at 0.6110 and the 0.6175 barrier. Also, it found significant support at the 0.5910 level and the lower surface of the Ichimoku cloud.
The RSI indicator is suggesting weak upside movement while the MACD is flattening, confirming the recent view in the short-term. Immediate resistance is coming from the 0.6175 and a close above this line could extend the move towards the 61.8% Fibonacci at 0.6260. Breaching these levels, the 200-day simple moving average (SMA) currently at 0.6313 would come into the spotlight ahead of the 0.6445 high.
A reversal to the downside could find immediate support at the 20- and 40-day SMA at 0.6050 and 0.6018 respectively before slipping to the 38.2% Fibonacci at 0.5956. If the latter fails to halt bearish movements, the next target could be at 0.5910 and 0.5840. Clearing these obstacles, the 23.6% Fibo of 0.5770 could be a level for a potential rebound.
Overall, NZDUSD seems to be neutral in the short-term but the outlook in the medium-term remains negative.
Origin: XM