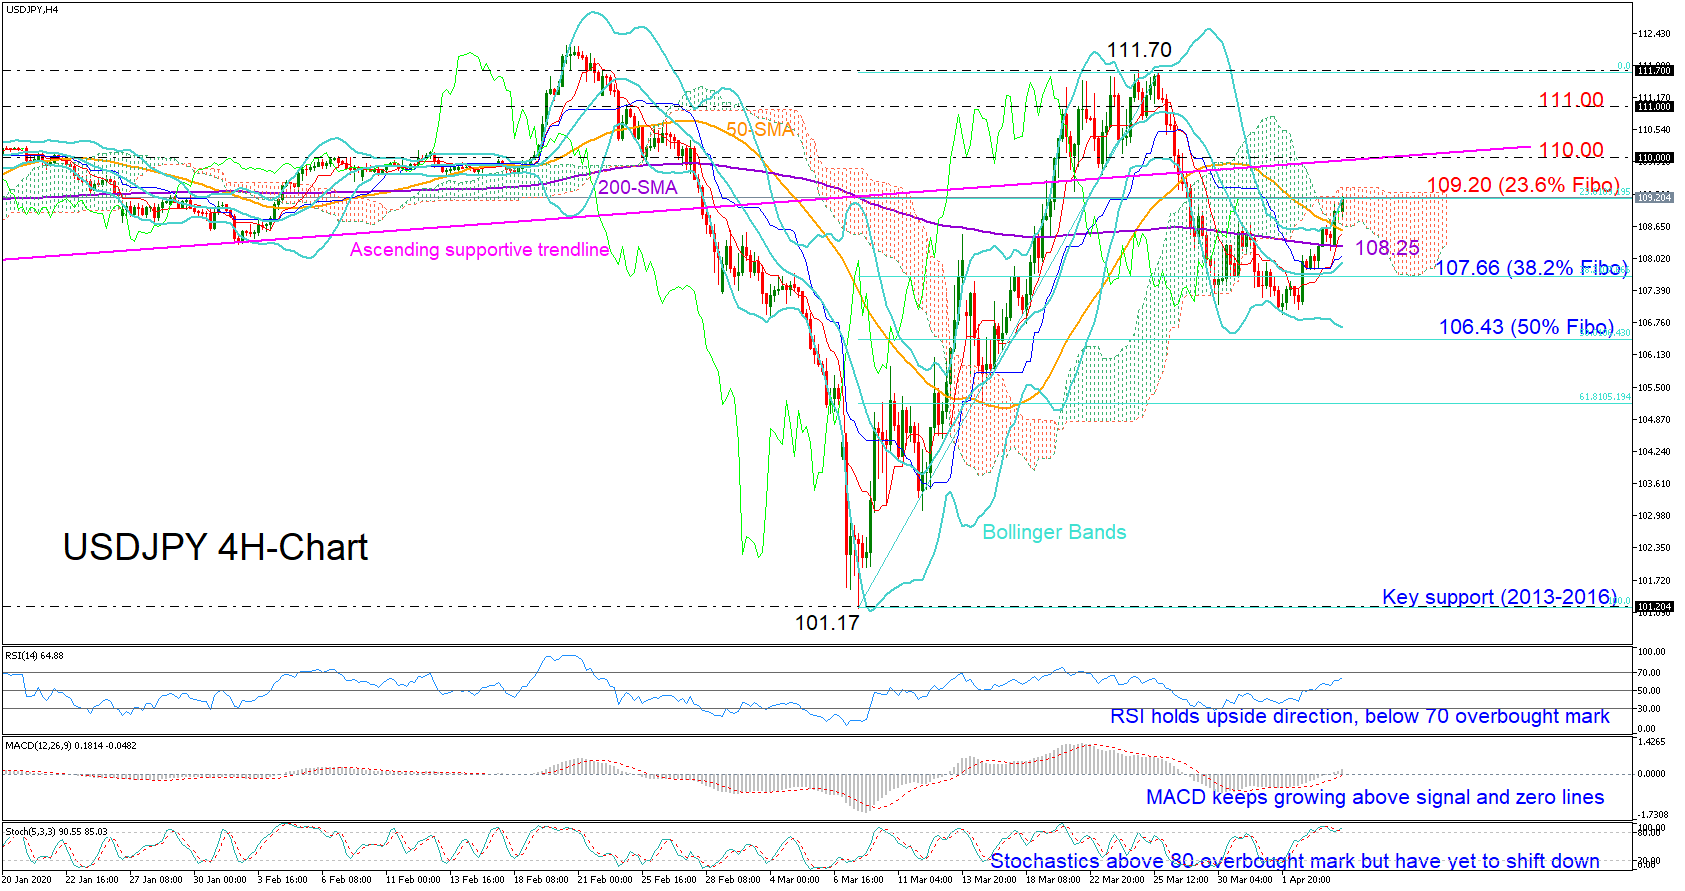
 USDJPY restored positive momentum on Monday and pierced the 109.00 level on the upside after stepping on the 200-period simple moving average (SMA) on the four-hour chart.
While some stabilization cannot be ruled out since the 23.6% Fibonacci of the 101.17-111.70 upleg is in the neighborhood and the fast Stochastics are fluctuating in the overbought territory, the price could soon resume upside direction as the MACD is growing in the positive area and the RSI keeps pointing up.
Should the price close above the 23.6% Fibonacci of 109.20, the bulls should also breach the 110.00 level and the broken ascending trendline drawn from the 2019 low of 104.44 to extend the rally towards the 111.00 psychological mark and then up to the 111.70 peak.
Otherwise, a downside reversal could see the retest of the 108.25-107.66 region formed by the 200-period SMA and the 38.2% Fibonacci. Failure to hold above this area could trigger fresh selling towards the lower Bollinger band and the 50% Fibonacci of 106.43, where any violation would mark a new lower low, reducing confidence on the March uptrend.
Summarizing, USDJPY is expected to trade bullish if the 109.20 barrier lets the bulls out.
Origin: XM