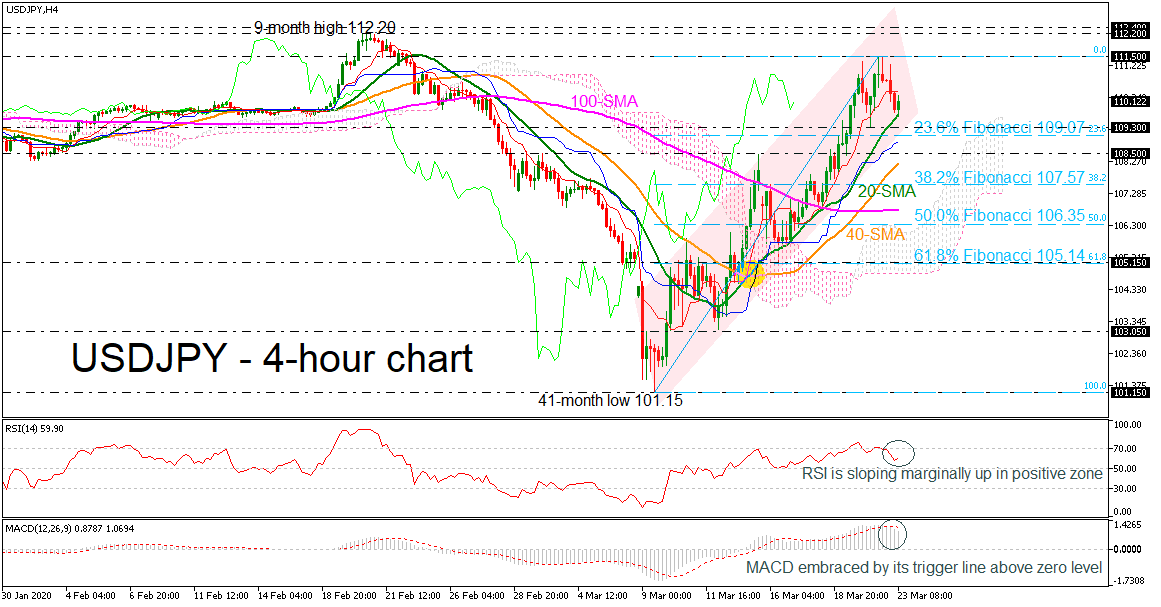
 USDJPY has been creating an upward sloping channel since the bounce off the more than three-year bottom on 101.15, achieved on March 9, in the 4-hour chart. Currently, the price is capped by the red Tenkan-sen line and finds support at the 20-period simple moving average (SMA), looking forward for a potential positive session.
According to the technical indicators, the RSI is heading marginally up in the positive territory, after the downfall from the overbought zone. However, the MACD is falling beneath its trigger line, remaining well above its zero level.
In the case that the pair finds crucial support at the 20-period SMA, immediate resistance would come from the latest high of 111.50, identified last week, before resting near the 112.20 – 112.40 resistance zone, which encapsulates the nine-month peak. More upside pressure could send prices above the sloping channel, testing the 113.70 barrier, from December 2018.
On the flipside, if the price drops below the 20-period SMA, it could challenge the 109.30 support and the 23.6% Fibonacci retracement level of the up leg from 101.15 to 111.50 at 109.07. More losses could see the 108.50 level and the 40-period SMA currently at 108.26. If the barrier fails to halt the bears, it would send the market until the 38.2% Fibonacci of 107.57, which is near the Ichimoku cloud.
Overall, USDJPY has been moving higher over the last couple of weeks, suggesting an upside pullback.
Origin: XM