


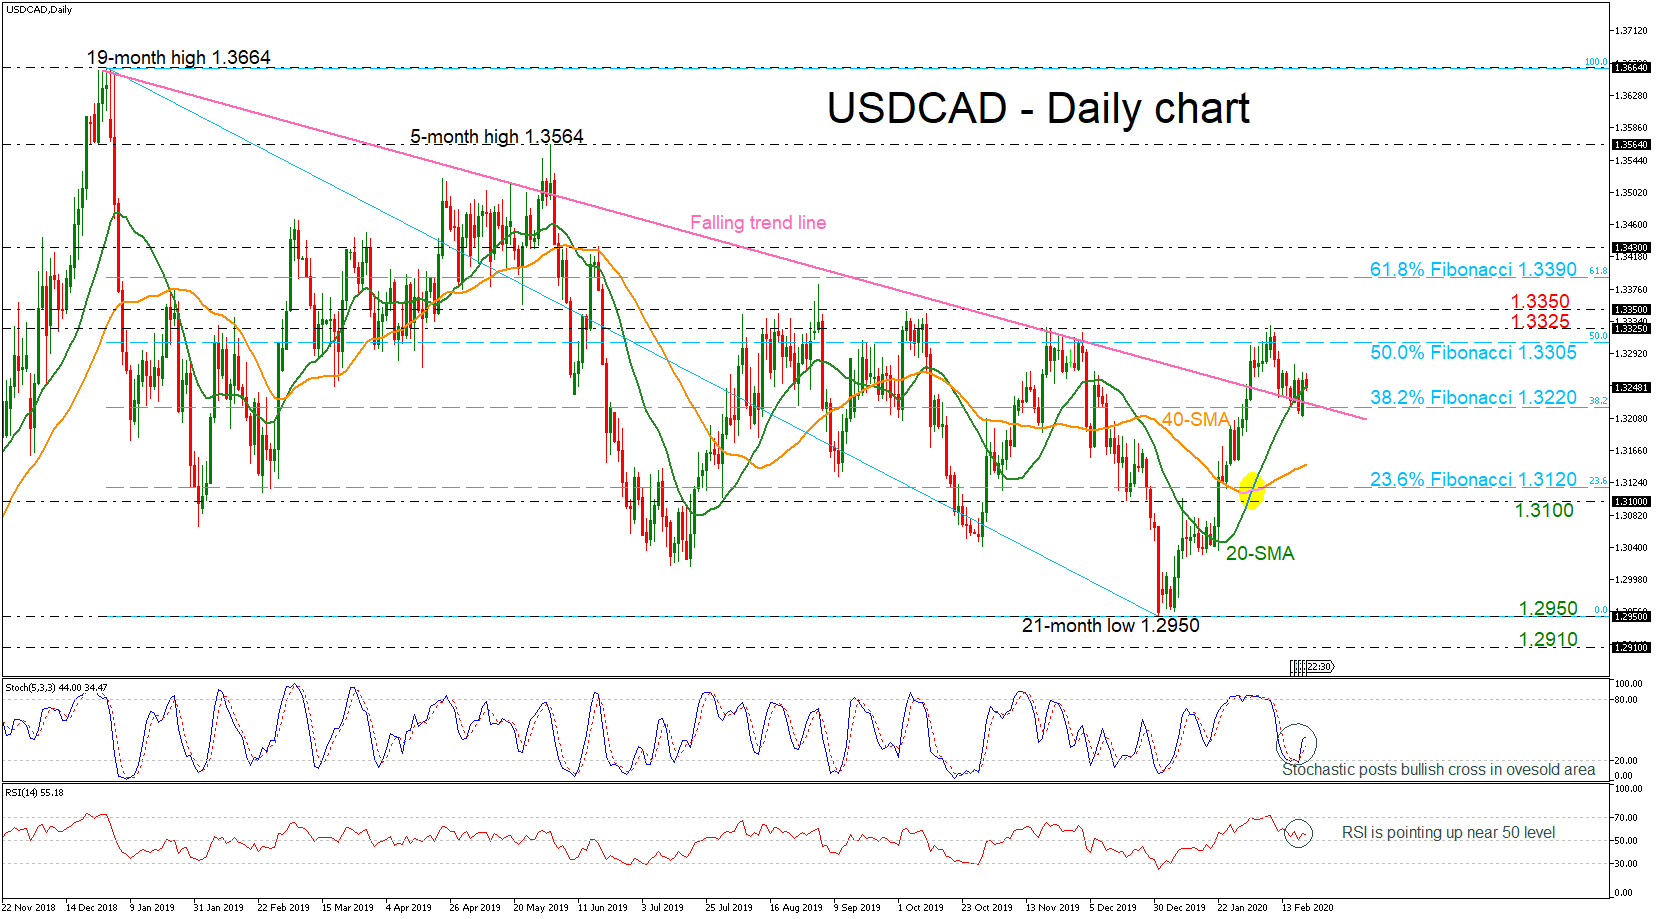
 USDCAD has found strong support area near the penetrated descending trend line and the 38.2% Fibonacci retracement level of the bearish move from 1.3664 to 1.2950 around 1.3220.
In the short-term, the outlook seems to turn slightly bullish after the jump towards the 1.3325 resistance and the momentum indicators are holding in bullish area. The stochastic oscillator completed a positive cross in the oversold zone, while the Relative Strength Index (RSI) is moving sideways after the bounce on the 50-neutral threshold.
If price action remains above 1.3220 (immediate support), there is scope to test the 50.0% Fibonacci of 1.3305. Clearing this key level would see additional gains towards the 1.3325 – 1.3350 zone which has been rejected a few times in the past. Rising above it would see prices re-test the 61.8% Fibo of 1.3390 and then from this level and above, there would be a signal for bullish structure.
In the wake of negative pressures, the market could meet support at the 40-day simple moving average (SMA) currently at 1.3143 before it heads lower to the 23.6% Fibo of 1.3120. A successful close below this level could see a retest of the 1.3100 psychological mark, while in case of steeper declines, the pair could breach this barrier, diving to the 21-month bottom of 1.2950.
In the short term, the bullish outlook remains intact, with the moving averages all pointing upwards. However, should prices decline towards the 40-day SMA, this would risk shifting the medium-term picture to a negative one again.
Origin: XM


