 USDJPY attempted to reach January’s 8-month high of 110.28 on Wednesday but efforts proved fruitless as the price pulled back into the 109.00 territory early on Thursday.
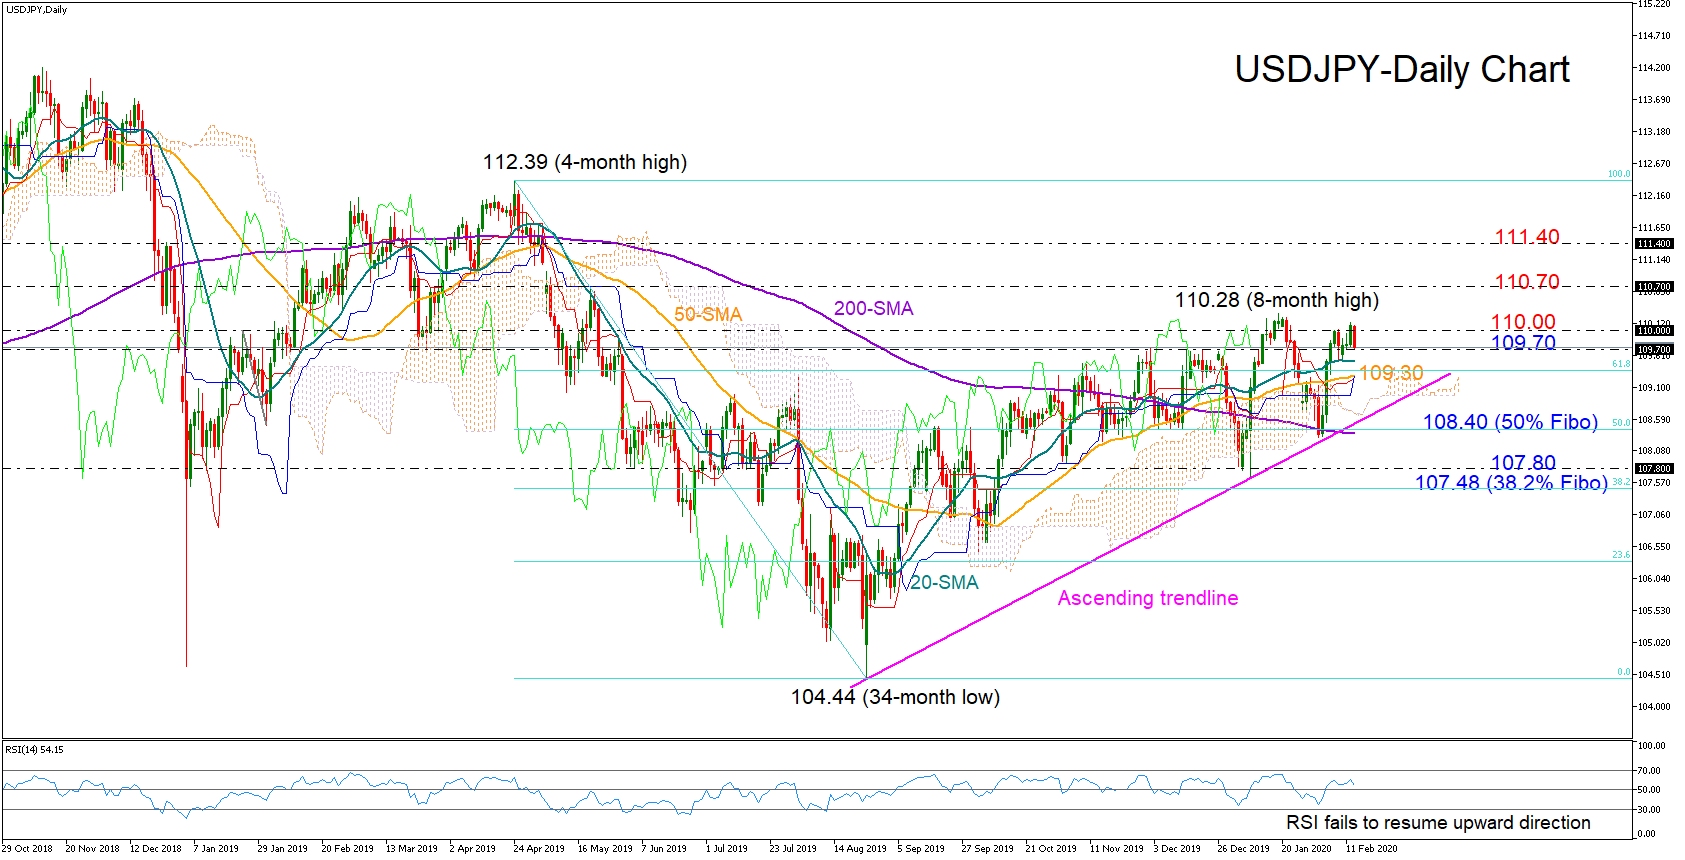
The falling RSI, which failed to resume upward direction on Wednesday, suggests that momentum in the price may remain weak in the short-term. Yet, as long as the indicator continues to move above its 50 neutral mark, upside corrections cannot be ruled out.
Currently, the 109.70 barrier is restricting the move down for the third consecutive day. Should it fall apart, the sellers may need to drive below the 50-day simple moving average (SMA), which is slightly below the 61.8% Fibonacci of the 112.39-104.44 dowleg, to extend the downfall towards the ascending trendline. A closing price below the trendline and the Ichimoku cloud, and more importantly beneath the 50% Fibonacci of 108.40 and the 200-day SMA, could trigger a new sell-off towards the 107.80-107.48 support area, where any break lower would confirm the start of a downtrend and a bearish outlook in the medium-term picture.
In case of a rebound, the bulls would push harder to clear the 110.00-110.28 resistance zone and head towards 110.70. Higher, the 111.40 mark has been a tough obstacle to upside and downside movements in the past and therefore should be watched if the rally picks up more steam.
In brief, USDJJPY is expected to be congested in the short-term unless the price falls below its shorter-term SMAs or rallies above 110.28. In the medium-term picture, a negative outlook would come into play below 107.48.
Origin: XM