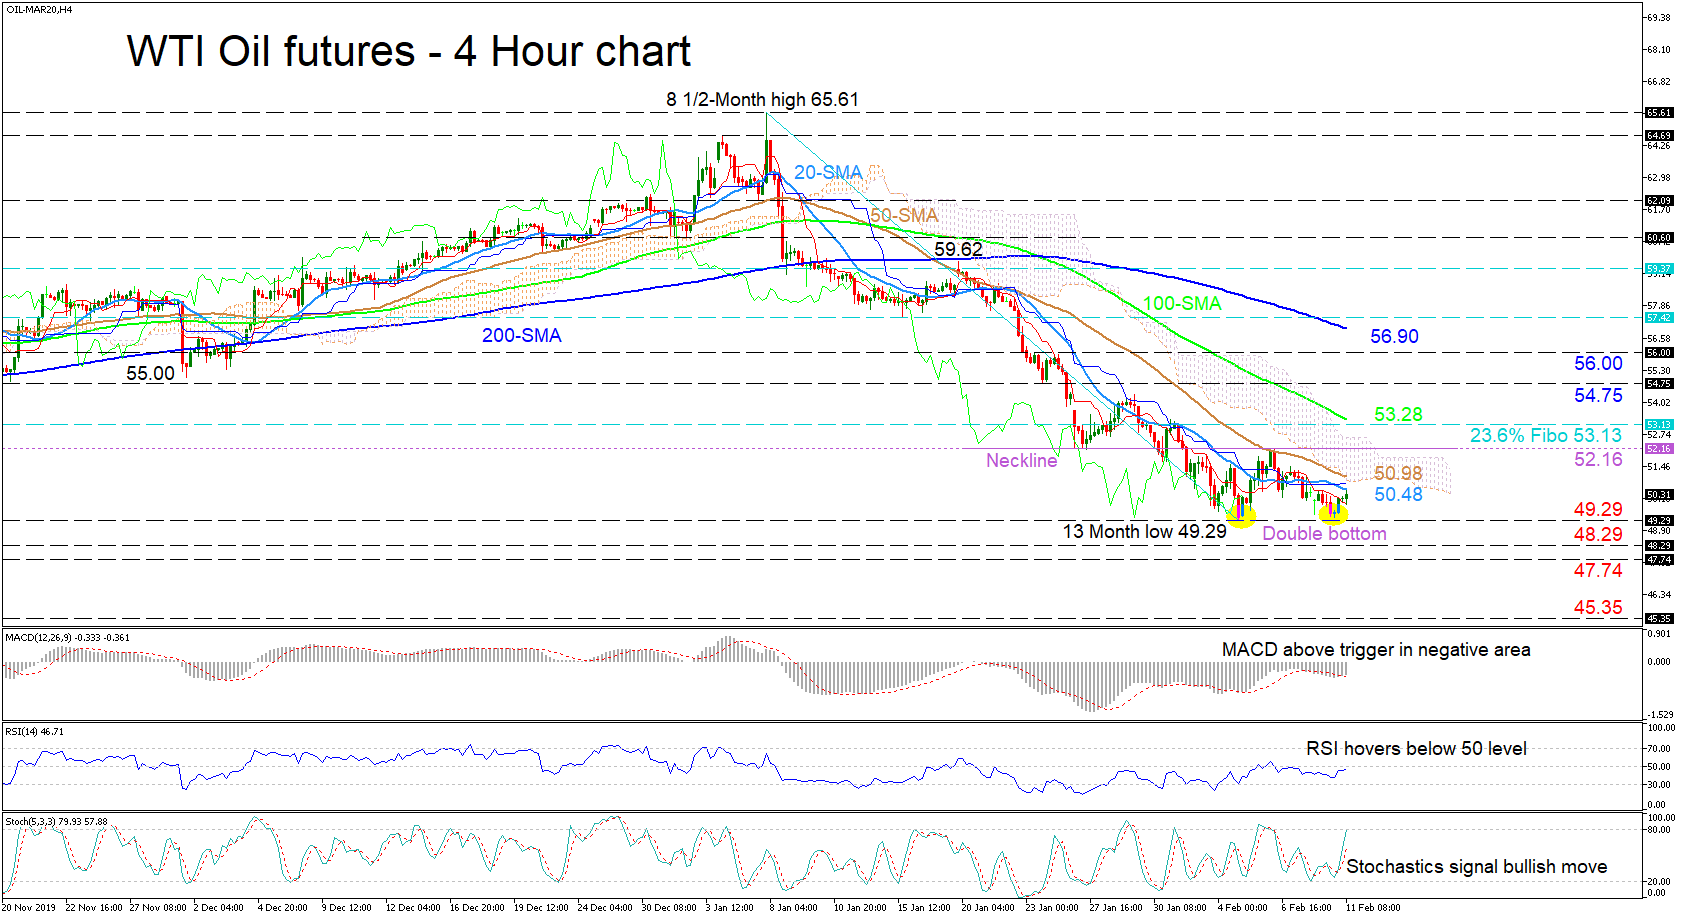
 WTI oil futures yesterday reversed ahead of the 49.29 fresh bottom – which is a thirteen-month low – forming the start of a likely double bottom pattern. Currently, the overhead Ichimoku cloud, the slipping red Tenkan-sen and all downward sloping simple moving averages (SMAs) promote a strong negative picture.
Moreover, the RSI is hovering below its 50 mark, further backing this view. That said, the MACD, in the negative region has climbed above its red trigger line, while the Stochastic %K line has accelerated above its %D line towards the 80 level. Worth mentioning, is the marginal increase in the blue Kijun-sen line, which further backs an improving outlook, aiding the double bottom pattern.
If sellers manage to retake control and steer the price below the multi-month low of 49.29, the next barriers to further declines comes from the 48.29 support from 08 January 2019 and the 47.74 inside swing high from 02 January 2019. If selling persists past these levels, the drop could challenge the 45.35 low from 03 January 2019.
Alternatively, immediate resistance could come from the 20-period SMA at 50.48 until the 50-period SMA at 50.98, which also encompasses the Kijun-sen line and lower band of the cloud. Clearing this key area, the 52.16 neckline resistance may come into focus. Provided, the bulls surpass the 52.16 obstacle – which would validate the completion of the pattern – the 53.13 hurdle, being the 23.6% Fibonacci retracement of the down leg from 65.61 to 49.29, could halt further advances. Overcoming the 100-period SMA at 53.28, the 54.75 and 56.00 resistances could test the climb towards the 200-period SMA at 56.90.
Overall, a break above the 52.16 neckline would reverse the prevailing bearish bias in the very short-term to a bullish one.
Origin: XM