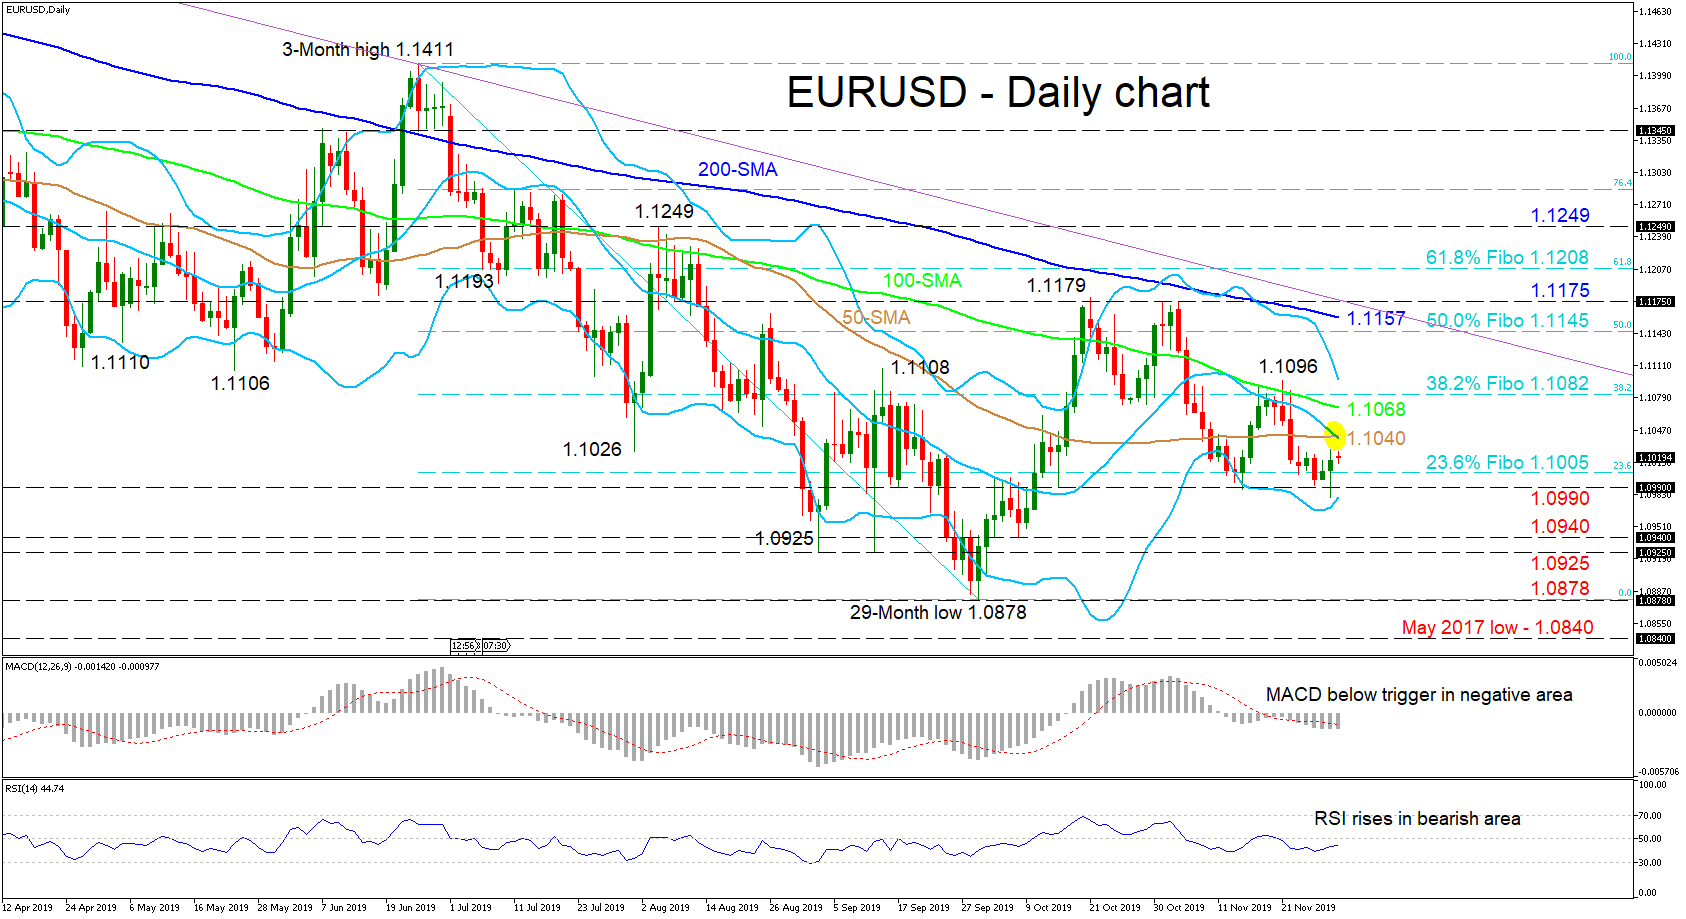
 EURUSD found some difficulty in pushing below the 1.0990 support, returning the price back above the 1.1005 level, which is the 23.6% Fibonacci retracement of the down leg from 1.1411 to 1.0878. The picture seems negative overall, given the downward slopes in the 200-day simple moving average (SMA), as well as the 100-day one and 20-day mid-Bollinger band.
That said, negative directional momentum seems to have stalled, something reflected by the flat 40-day SMA and the short-term oscillators. The MACD, although below its red trigger line and in the negative zone, has flattened, while the RSI – also located in the bearish region – is rising towards its neutral mark.
If sellers pick up, immediate support to surpass is the 23.6% Fibo of 1.1005 followed by the area of 1.0990 to 1.0980, related to the swing lows from October 15 and November 14 and where the lower-Bollinger band lies as well. Diving lower, another support area from 1.0940 to 1.0925 could halt further declines towards the multi-year low of 1.0878 and 2017 May low of 1.0840.
To the upside, initial resistance comes from the bearish cross residing around 1.1040, ahead of the 100-day SMA at 1.1068 and neighboring 38.2% Fibo of 1.1082. Climbing higher, the nearby upper-Bollinger band coinciding with the swing high of 1.1096 could interrupt the test of a more challenging region from 1.1145 to 1.1175, where the 50.0% Fibo, the 200-day SMA and peak of 1.1175 exist.
Overall, the short-term is looking increasingly bearish and a break below 1.0990 would strengthen the negative outlook. Yet, a break above 1.1175 could throw into question the medium-term negative bias.
Origin: XM