 The euro spent on the Fibonacci line 123.6% between the balance line and the price channel line on the daily scale chart for all of yesterday. During this time, the signal line of the Marlin oscillator leaned even more down, indicating the most likely price path. If there are no fundamental surprises, we are waiting for the euro on the MACD line in the price area of 1.1012. Price consolidation above the peak on November 18 (1.1090) will mean automatic consolidation also above the price channel line, and this can lead to an increase to the Fibonacci level of 110.0% at the price of 1.1155.
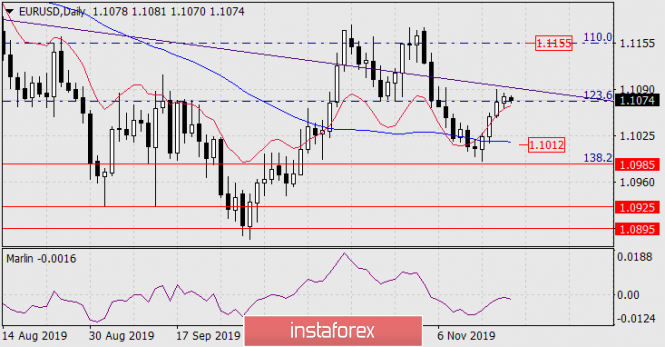
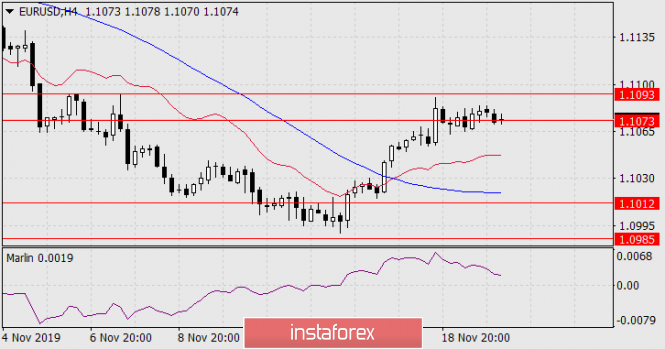
On the four-hour chart, the price currently tends to go below the Fibonacci level of 123.6% (1.1073). Success, that is, consolidating below the level, will lead to a further fall in price to support the MACD line, and the MACD lines on both charts coincide at a price of 1.1012 (after all, on H4 the line will decrease slightly when the price decreases). The coincidence of lines of two scales at one point strengthens the level. Correctional growth is likely from it. Conversely, leaving the price below the level will strengthen a further decline. The Marlin oscillator signal line is still developing in the growth zone, this is a signal of caution.
Origin: InstaForex