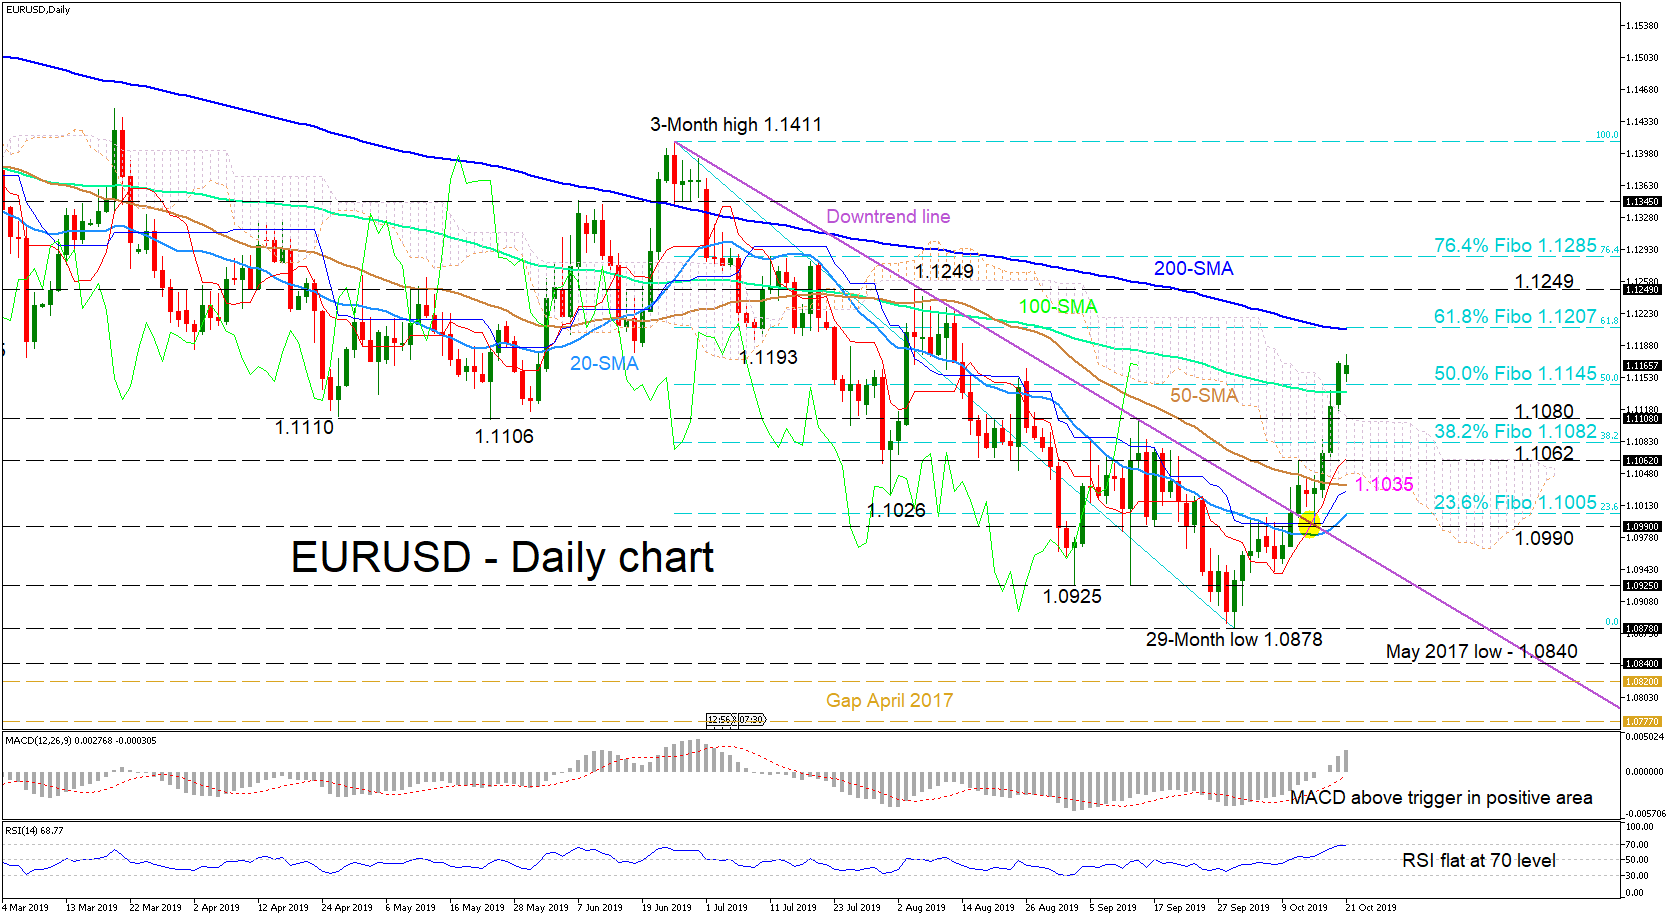
 EURUSD buyers have ascended above 1.1145, which is the 50.0% Fibonacci retracement of the down leg from 1.1411 to 1.0878. The bounce off the broken downtrend line at 1.0990 – where the Tenkan-sen completed a bullish crossover – propelled the price through the Ichimoku cloud, overcoming various resistance obstacles.
Momentum oscillators back a short-term positive outlook. The MACD has distanced itself above its red trigger line and into the positive zone, while the RSI has risen to the 70 level. Moreover, a turn up in the 20-day simple moving average (SMA) nears a bullish cross of the 50-day SMA, thus warranting that a shift in the bias may be approaching. At the same time, a conflicting bigger negative picture from the downward sloping 200-, 100- and 50-day SMAs persists.
If the bulls continue to dominate, the price could initially rise to test the formidable 200-day SMA residing at the 61.8% Fibo of 1.1207. Violation of the 200-day SMA could lift the pair to the 1.1249 swing high of August 6, ahead of the swing peaks around 1.1285 where the 76.4% Fibo also lies.
To the downside, if the bears retake control and pivot the price back down, initial support could come from the 50.0% Fibo of 1.1145 and slightly lower, from the 100-day SMA. Falling, a breach of the 1.1080 support would move the price into the cloud to face the 38.2% Fibo of 1.1082, followed by the 1.1062 inside swing of October 11.
Overall, a short-term bullish-to-neutral bias exists, while a break above 1.1285 would confirm the neutral picture. However, a move below 1.0990 may bring the bigger bearish picture back into focus.
Origin: XM


