USDCAD’s momentum has evaporated after buyers yesterday reversed the price up to close above the 100-day simple moving average (SMA) and the flat Kijun-sen line, which have converged within the trading range.
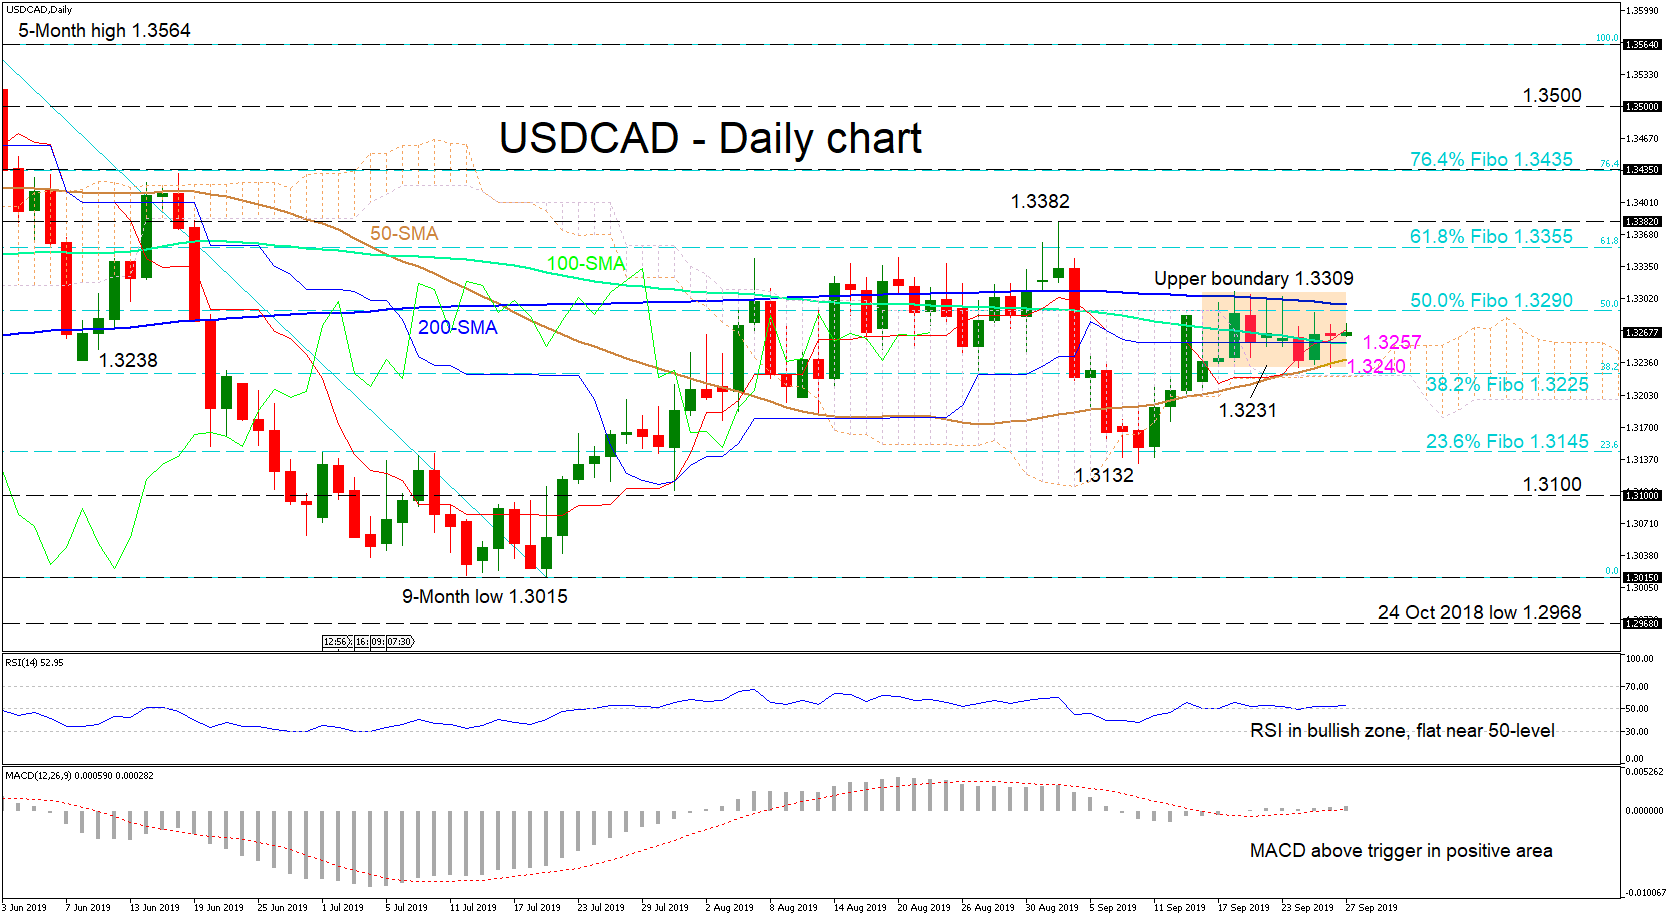
The short-term oscillators imply that momentum has dried up but favor the positive picture. The MACD is only just above zero and its red trigger line, while the RSI hovers in bullish territory, marginally above the 50-level. It’s worth mentioning that the upward sloping Tenkan-sen has completed a bullish cross with the Kijun-sen line suggesting a pickup in short-term positive momentum. Moreover, the 50-day SMA also looks to be approaching a bullish cross of the 100-day SMA.
If price action remains above the cloud and buying interest increases, the pair could find initial resistance within the range at 1.3290, which is the 50.0% Fibonacci retracement of the down leg from 1.3564 to 1.3015, as well as the nearby 200-day SMA. A successful breach would turn traders’ focus to the 76.4% Fibo of 1.3435, once the climb higher has decisive backing to overcome the swing high of 1.3382.
In the downside scenario, things look bleaker, as the bears would need to steer the price ultimately below the 38.2% Fibo of 1.3225 where the Ichimoku cloud also resides, thus overcoming the 100-, 50-day SMAs and the 1.3231 lower boundary respectfully. Moving lower, the door would open for the nine-month low of 1.3015, once the 23.6% Fibo of 1.3145 is surpassed.
Overall, the short-term picture remains neutral. A break above 1.3309 or below 1.3231 would need to occur for the directional bias to be exposed.
Origin: XM