


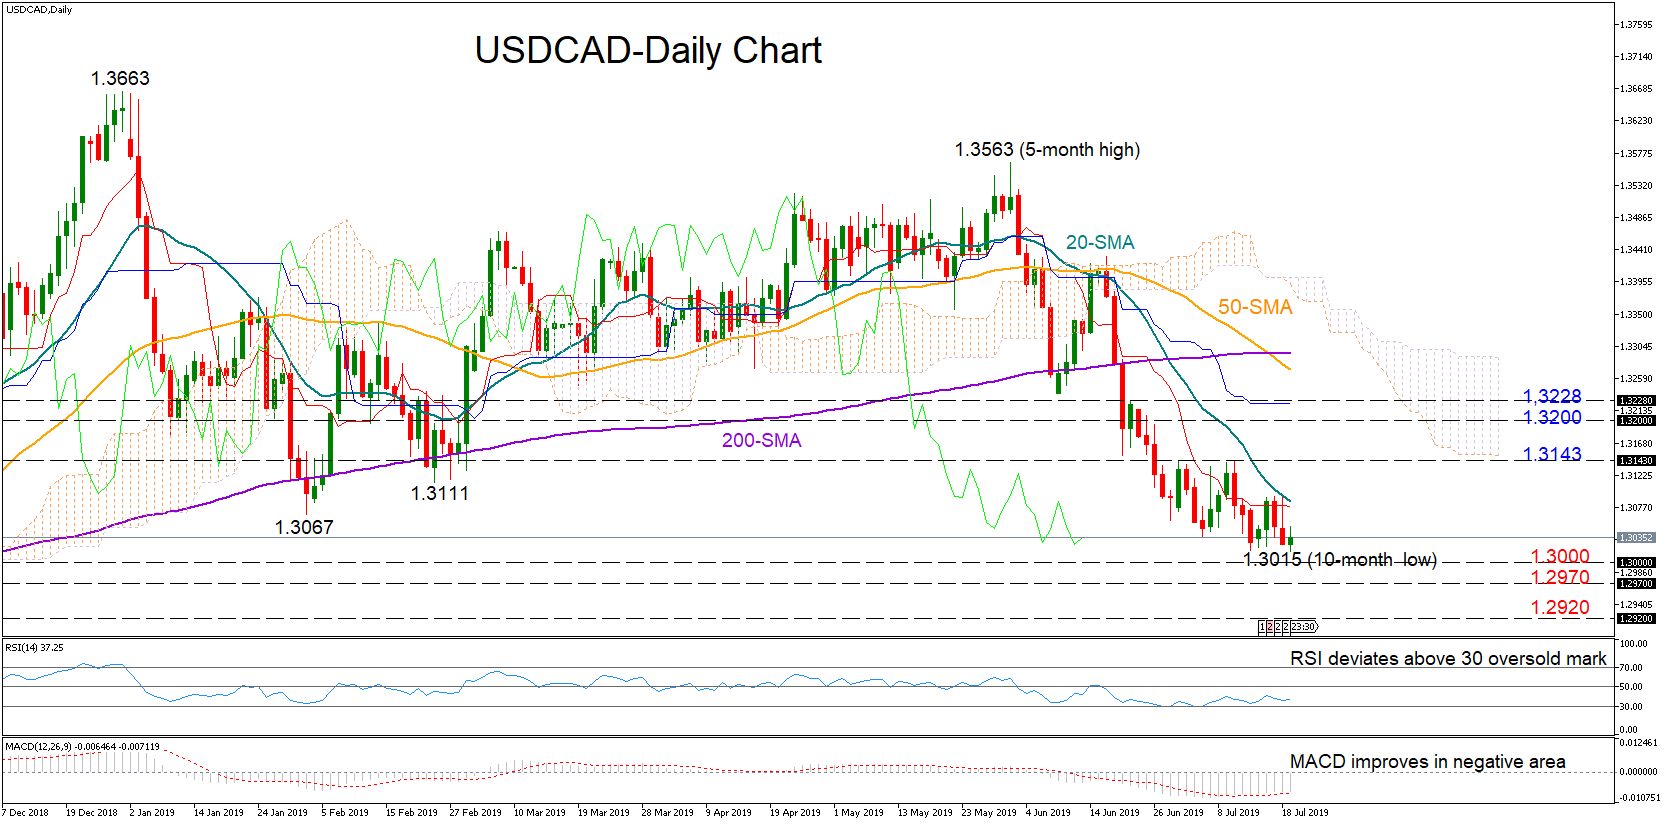
 USDCAD experienced an uneventful week, moving sideways between the 20-day simple moving average (SMA) and its new ten-month low of 1.3015. In Ichimoku indicators, the red Tenkan-sen is flattening well below the blue Kijun-sen, while the RSI and the MACD keep gaining ground in the bearish territory, all signaling a neutral bias for the short-term.
The 20-day SMA at 1.3084 could act as immediate resistance if the price corrects to the upside. Breaking that line, the bullish action may likely continue until the previous highs around 1.3143, while higher the pair could begin a rally towards the 1.3200-1.3228 area.
In the negative scenario, where the price closes decisively below the 1.3000-1.2970 zone, negative momentum could accelerate towards the 1.2920-1.2900 former resistance region before the focus shifts to the 1.2800 psychological level.
Meanwhile in the medium-term picture, trend signals are flashing red as the death cross between the 50- and the 200-day SMAs – the first in two years – foresees the continuation of the downward pattern.
In brief, the short-term risk is currently viewed neutral, while in the medium-term, the sentiment seems to be turning even more bearish.
Origin: XM


