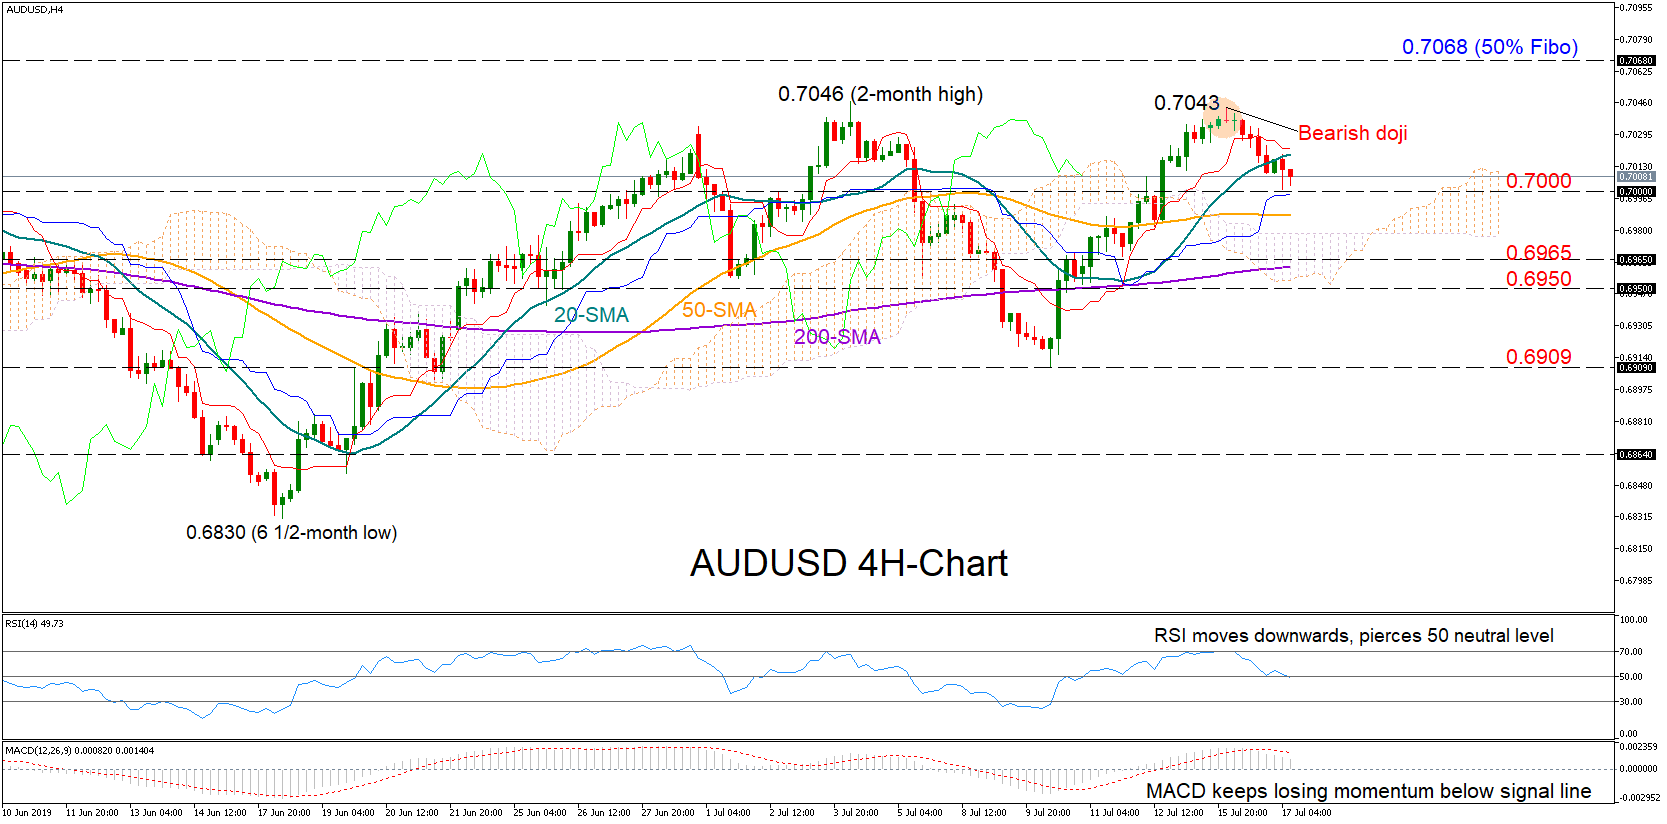
 AUDUSD changed direction to the downside after printing a bearish doji near the two-month high of 0.7046 in the four-hour chart, keeping the market within the 0.7046-0.6900 range. The price has also retreated below the 20-period simple moving average (SMA), while the weakness in the RSI and the MACD is an additional warning that bearish sentiment is likely to stay in the short-term.
A decisive close below the 0.70 mark could trigger fresh selling towards the key 0.6965-0.6950 key area, where the 200-period SMA is currently hovering. Crawling lower and under the Ichimoku cloud the door would open for the previous low of 0.6909.
The 20-period SMA at 0.7020 would come first into view and ahead of the 0.7046 ceiling if the bulls retake control. Clearing the recent tops, the next important resistance to keep in mind could be detected around the 0.7068 level which is the 50% Fibonacci of the steep downleg from 0.7392 to 0.6745. If this proves easy to get through, the rally may continue until the 0.7150 area.
In brief, AUDUSD is facing a bearish short-term risk in the four-hour chart. However for the market to violate its range-bound trading the price needs to break above the 0.7046 top or fall below the 0.6900 boundary.
Origin: XM