


 USDCAD rebounded on the 20-day simple moving average (SMA) several times in the preceding sessions, but it still remains below the four-month high of 1.3520. The risk is currently viewed as bullish-to-neutral as on the one hand the RSI seems to be changing direction southward to meet its 50 neutral mark, but the red Tenkan-sen is on a sideways move above the blue Kijun-sen and the MACD is trying to strengthen above its trigger line.
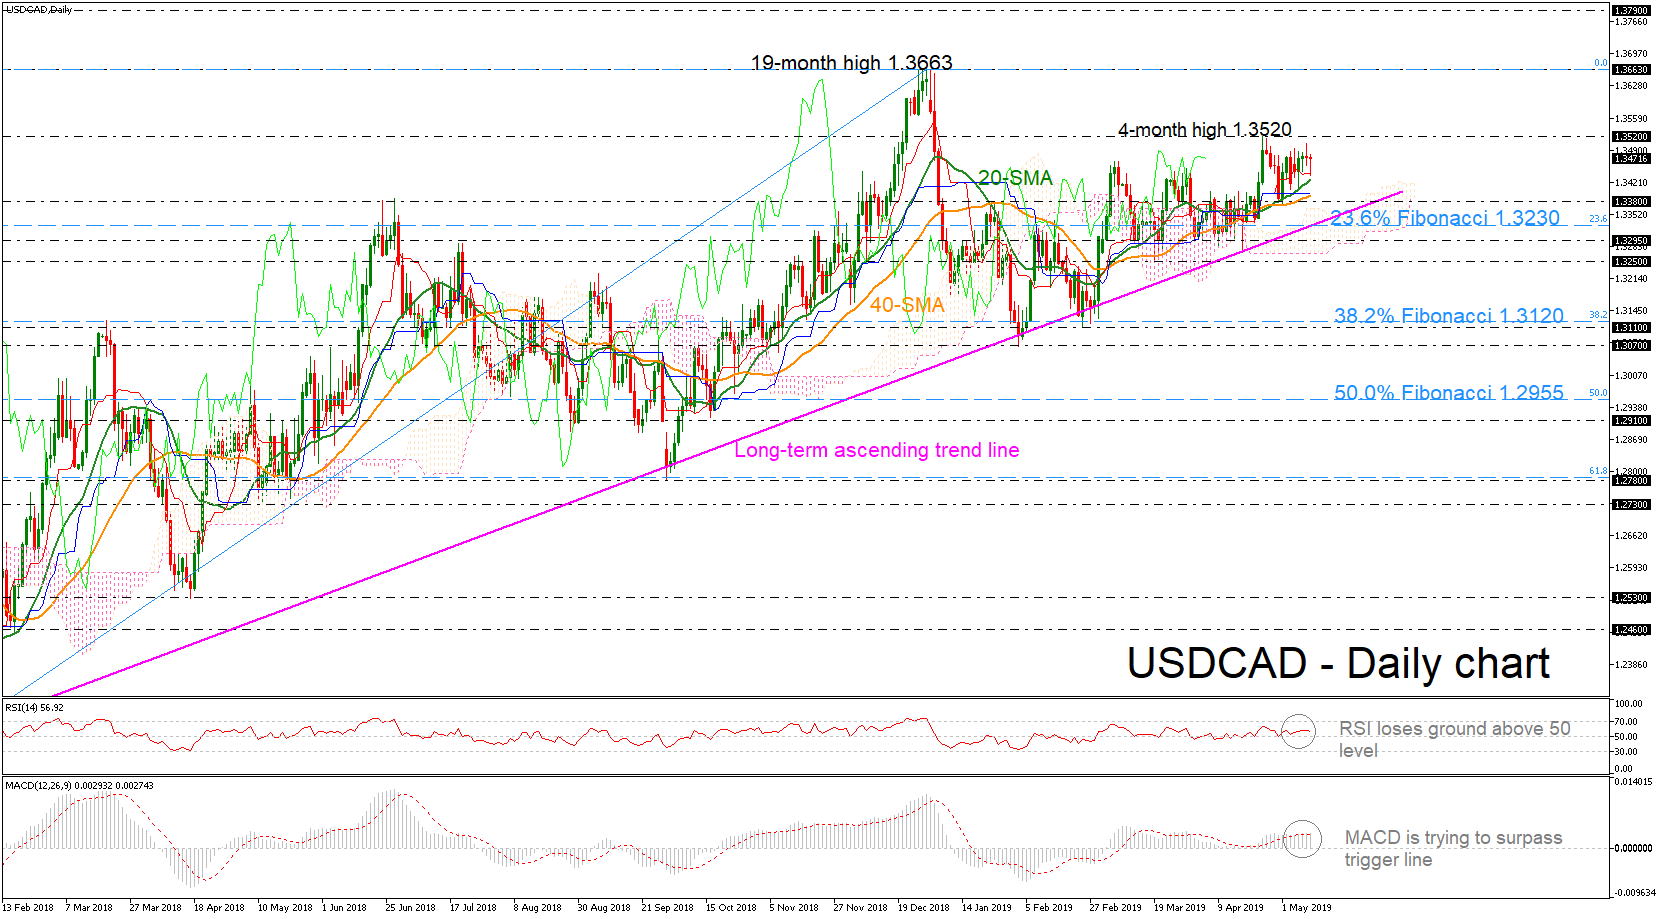
The bulls could set immediate target around the four-month high of 1.3520, while a break higher would open the way towards the 19-month high of 1.3663, reached on December 2018.
Otherwise, the 20-day SMA at 1.3430 could be watched in case of a negative correction. Should there be additional losses, the next support could be around the 1.3380 restrictive level, which stands near the 40-day SMA. A failure to hold above that number could then lead the price towards the 23.6% Fibonacci retracement level of the upleg from 1.2250 to 1.3663 around 1.3230, breaking the long-term ascending trend line.
In the long-term picture, USDCAD is strongly positive as long as the pair trades above the 16-month ascending trend line. Traders should wait for a daily close above 1.3520 for more bullish actions.
Origin: XM


