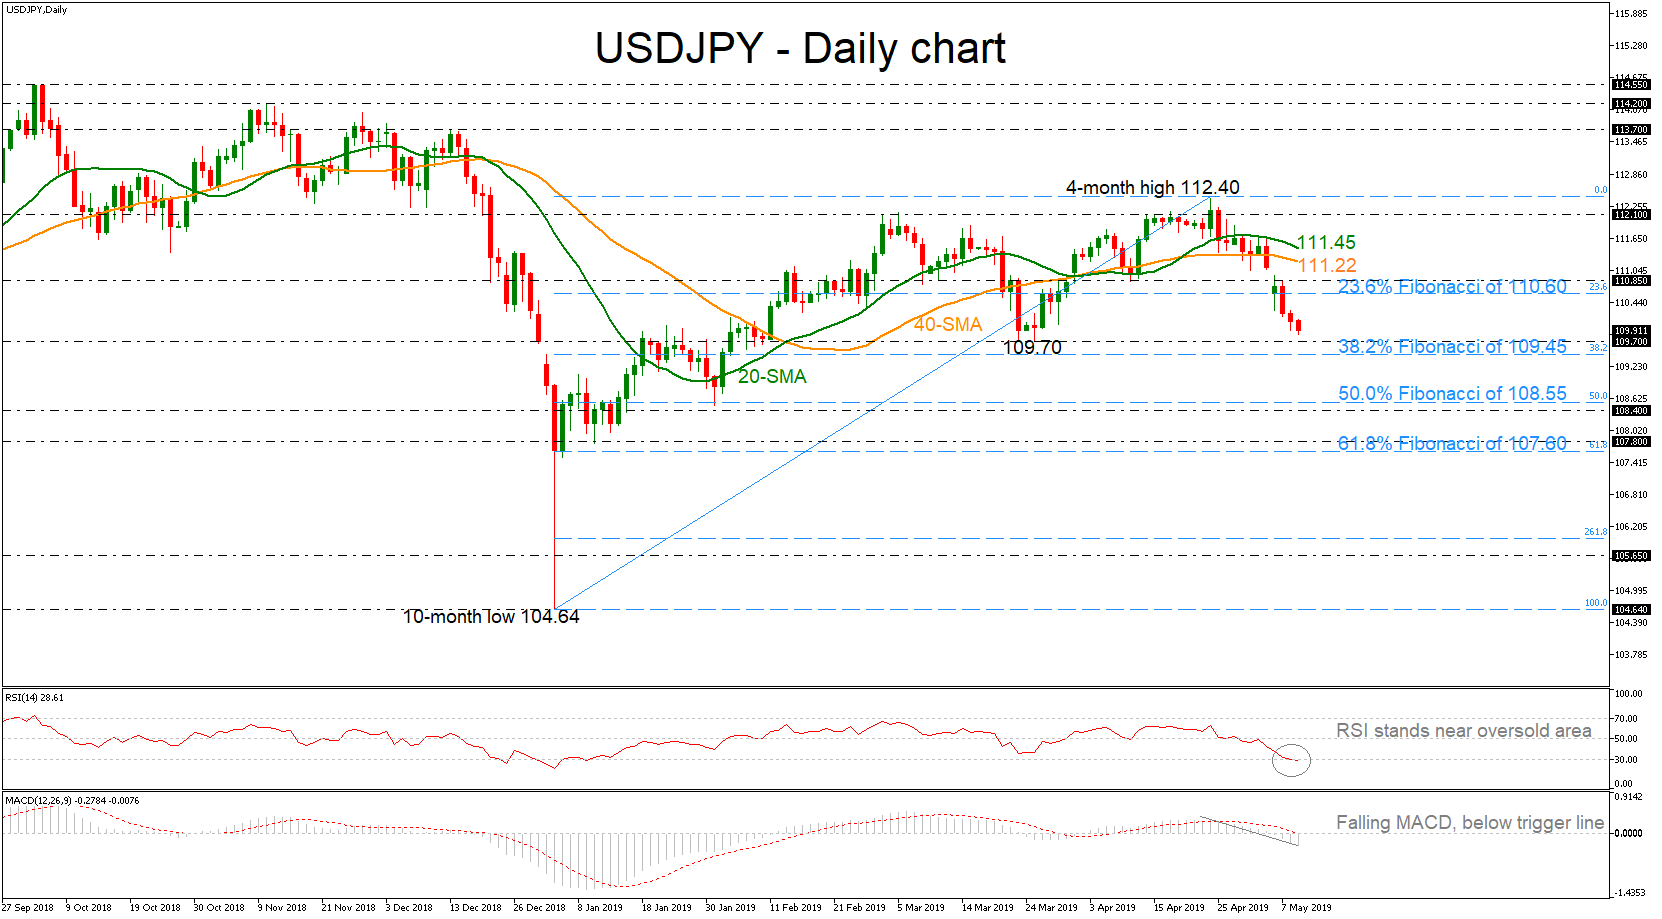
 USDJPY has been underperforming in the past two days, breaking back below the 23.6% Fibonacci retracement level of the upleg from 104.64 to 112.40, around 110.60, creating a bearish correction in the near term. When looking at the bigger picture the pair lacks a clear trend and has been consolidating within 104.60 and 114.55 since March 2017.
The short-term technical indicators are bearish and point to more weakness in the market. The RSI indicator is flattening in the oversold territory, while the MACD oscillator is extending its negative momentum below the trigger and zero lines in the daily timeframe.
Downside moves are likely to find support at the 109.70 barrier, before challenging the 109.45 level, which is the 38.2% Fibonacci. There is an important support zone between the 50.0% Fibonacci of 108.55 and the 108.40 obstacle, reached on January 31.
On the flipside, if the price returns higher and pares some of the losses, immediate resistance is coming from the 23.6% Fibonacci of 110.60 and the 110.85 hurdle. Rising above this area could see a re-test of the 40- and then the 20-simple moving averages (SMAs) currently at 111.22 and 111.45 correspondingly. Breaking this level also, could send prices towards the 112.10 – 112.40 key zone.
In the very short-term, the bearish phase remains in play especially if prices continue to trade below the 23.6% Fibonacci (110.60).
Origin: XM