


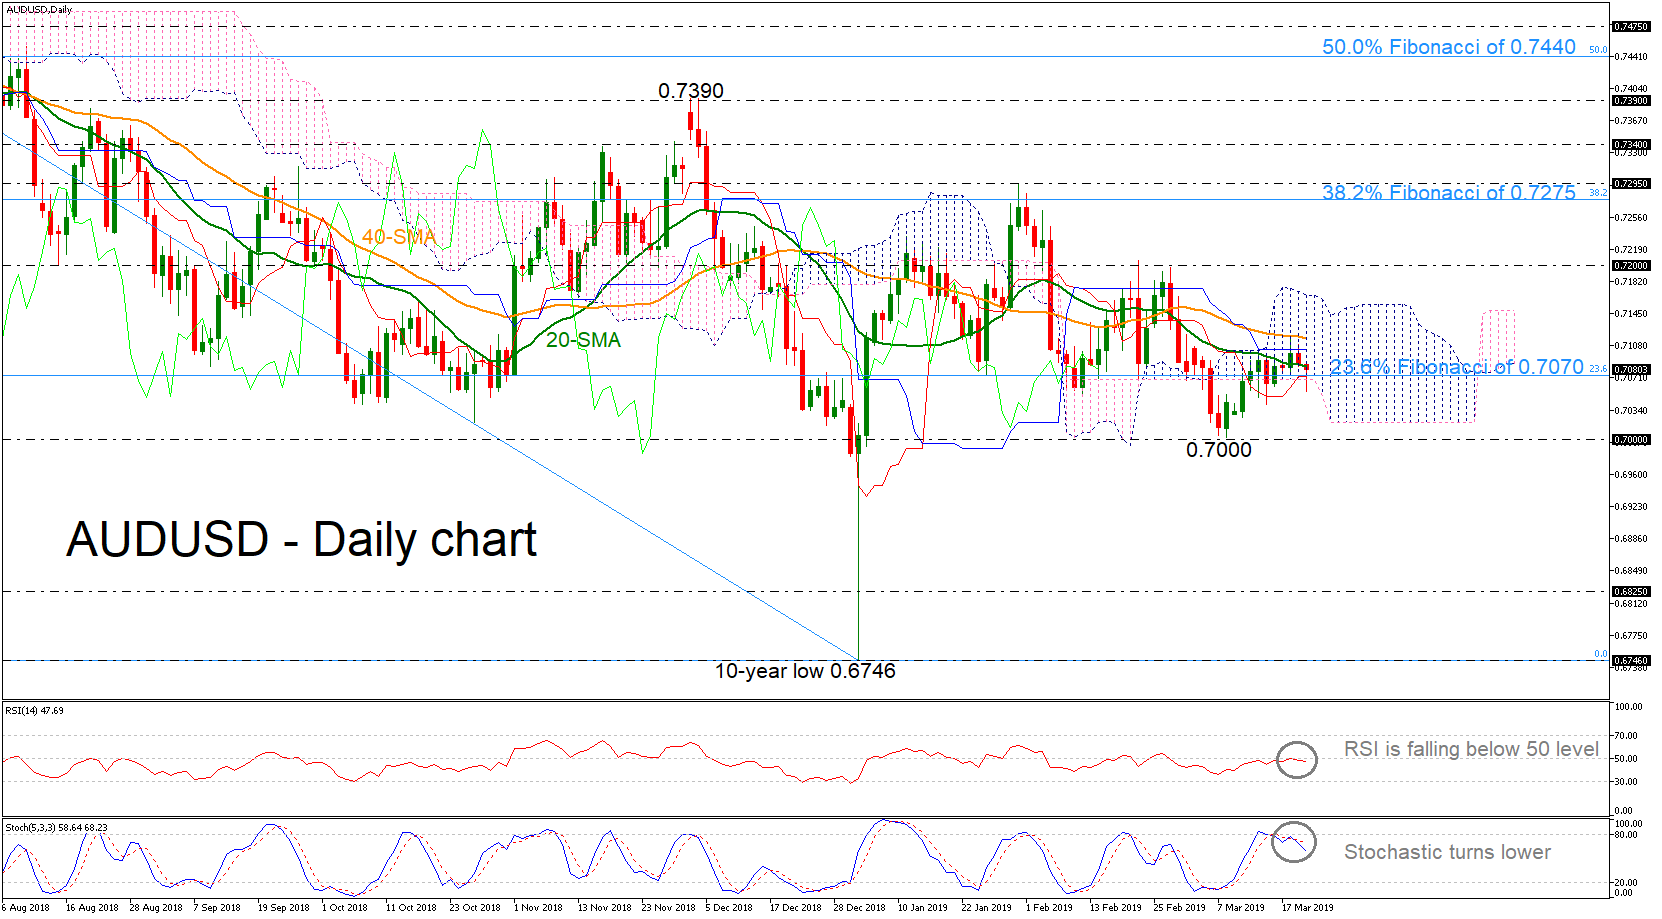
 AUDUSD has rebounded somewhat after falling to the 0.7000 psychological level on March 8 but is still moving with weak momentum within the Ichimoku cloud in the daily timeframe. The price is currently developing around the 23.6% Fibonacci retracement level of the downleg from the 32-month high of 0.8135 to the 10-year low of 0.6746, near 0.7070 and between the red Tenkan-sen and blue Kijun-sen lines.
The momentum indicators now suggest that the market sentiment might get worse before getting better as the stochastic is reversing back to the downside after the bearish cross within %K and %D lines. The RSI also looks to be changing direction, moving down below the 50 neutral threshold.
Should the price retreat further, immediate support is coming from the lower bound of the Ichimoku cloud around 0.7020, before dropping towards the 0.7000 handle. A successful decline below this line could drive the pair until the 0.6825 support, where it bottomed on January 2016 and then would rest near 0.6746, identified by the low on January 3. Lower still, a violation of the 10-year low would increase speculation that a bearish phase is in progress.
In the alternative scenario, traders would be eagerly looking for a break above the 40-daysimple moving average to increase buying orders towards the upper band of the Ichimoku channel near 0.7170. If bullish forces appear even stronger, the 0.7200 key level should be another resistance to keep in mind, while more upside pressure could touch the 38.2% Fibonacci of 0.7275.
Summarizing, in the long-term, AUDUSD stands in a narrow range within the 0.7000-0.7390 area over the last seven months.
Origin: XM


