


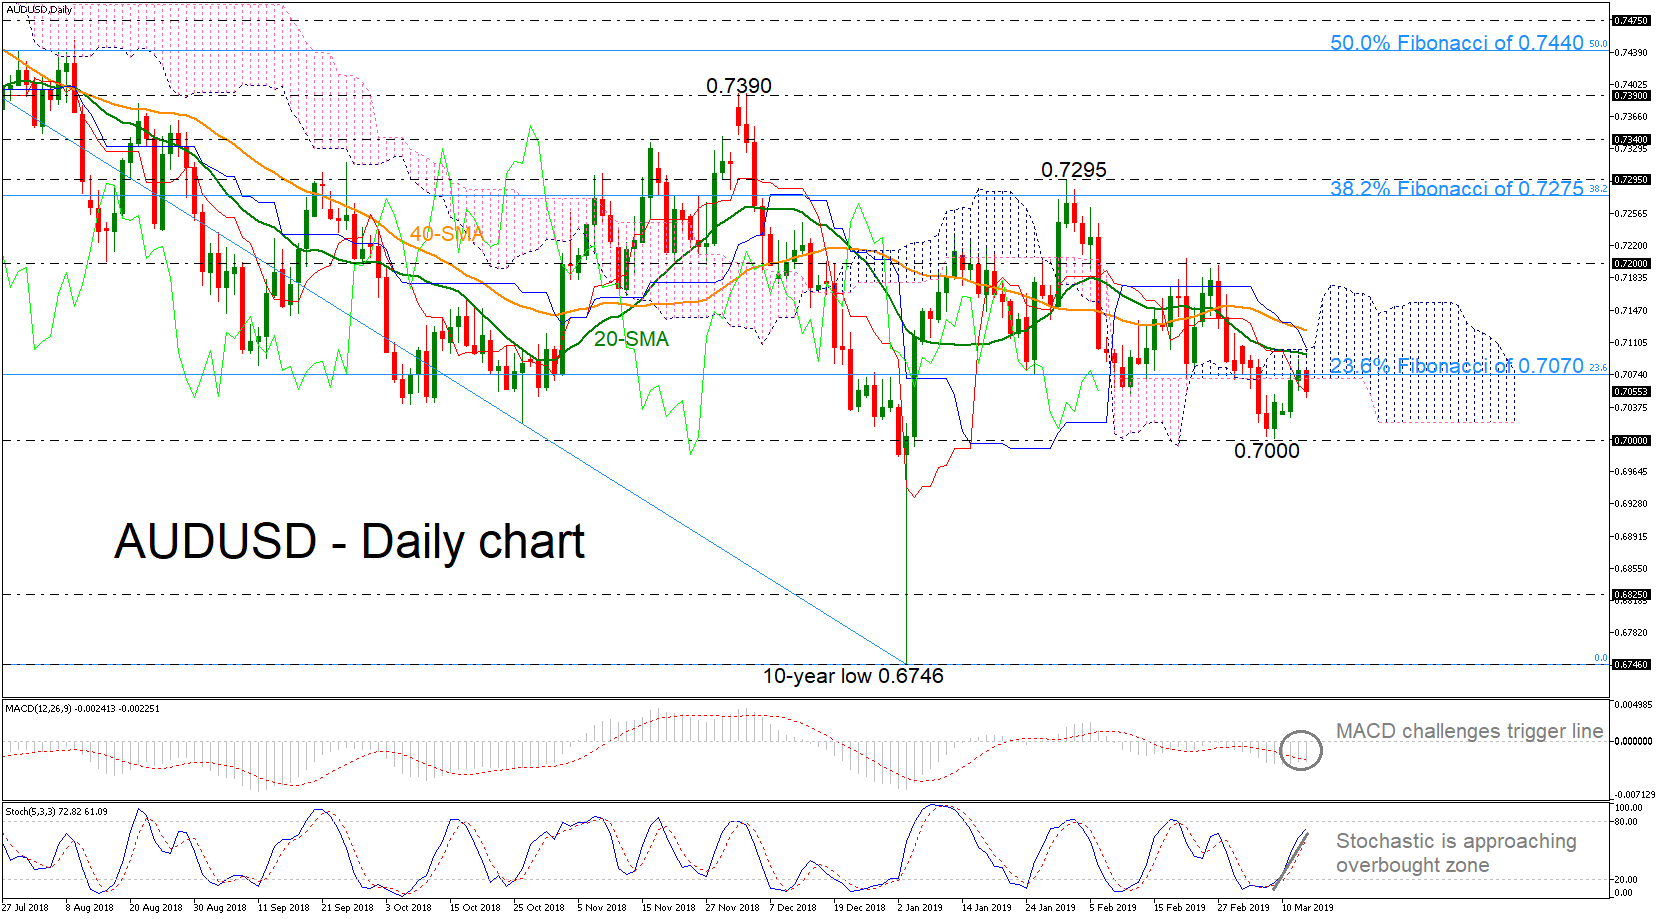
 AUDUSD stretched slightly to the downside today, falling back below the 23.6% Fibonacci retracement level of the downleg from 0.8135 to 0.6746, around 0.7070 and the Ichimoku cloud.
The technical picture remains to the upside as the MACD is trying to post a bullish crossover with the trigger line, while the stochastic is approaching the overbought zone. Also, currently, the price is trading below the 20- and 40-simple moving averages (SMAs) in the daily timeframe and the red Tenkan-sen and the blue Kijun-sen lines are sloping down, suggesting negative momentum.
Should bearish action continue below the 0.7000 region, support could be found around the 0.6825 barrier, taken from low on January 2016. A successful break lower, could then bring the ten-year low of 0.6746 back into view.
In case of a recovery above the Ichimoku cloud and the 20- and 40-SMAs, the 0.7200 handle could provide nearby resistance. If the bulls push the pair even higher, the 38.2% Fibonacci of 0.7275 and the 0.7295 resistance could come in focus.
Overall, in the long-term, AUDUSD stands in a narrow range within the 0.7000-0.7390 area over the last seven months.
Origin: XM


