 USDJPY crawled above the 200-day moving average (MA) and towards 2 ½-month highs on Monday but the upper bound of the ascending channel capped bullish action, with the price sliding sideways since then.
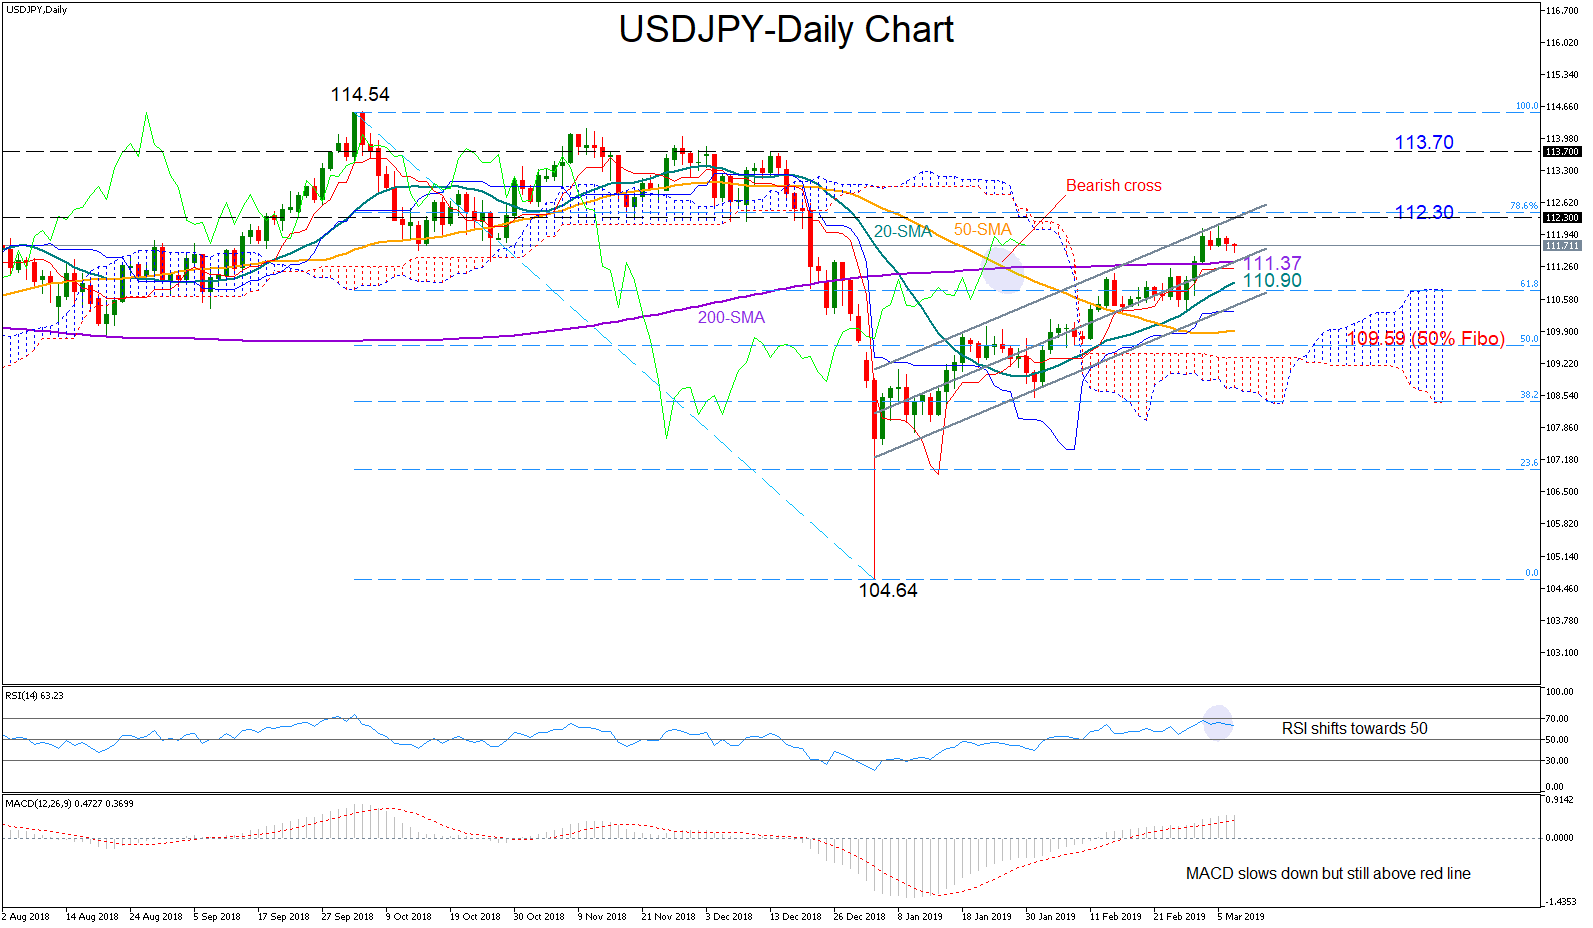
The RSI and the MACD are still positioned in the bullish zone, with the former above 50 and the latter above its red signal line, but both have already started to trend down, signalling that some weakness may emerge in the market. Meanwhile, the Ichimoku indicators, the red Tenkan-sen and the blue Kijun-sen lines, have paused upside momentum, adding evidence to the cautious mood.
If the pair stands tall again, the upper sloping parallel line of the channel seen at 112.30 would come first into test. A successful break of this wall could lift the price even higher to meet resistance near the 113.70 congested area. Yet the bulls need to overcome the 114.00 mark and more importantly beat the 114.54 top to extend the March uptrend and therefore switch the bigger picture into a bullish one.
Alternatively, if the bears take control, the price would reverse south to retest the 200-day MA currently flat at 111.37. Beneath that, the 20-day MA at 110.90 could also halt downside movements as it did at the end of February, while in case of steeper declines the price could end up near 109.59, the 50% Fibonacci of the downleg from 114.54 to 106.45.
Summing up, the positive short-term bias seems to be turning neutral, while in the bigger picture USDJPY is maintaining a neutral outlook within the 114.54-107.50 area.
Origin: XM