


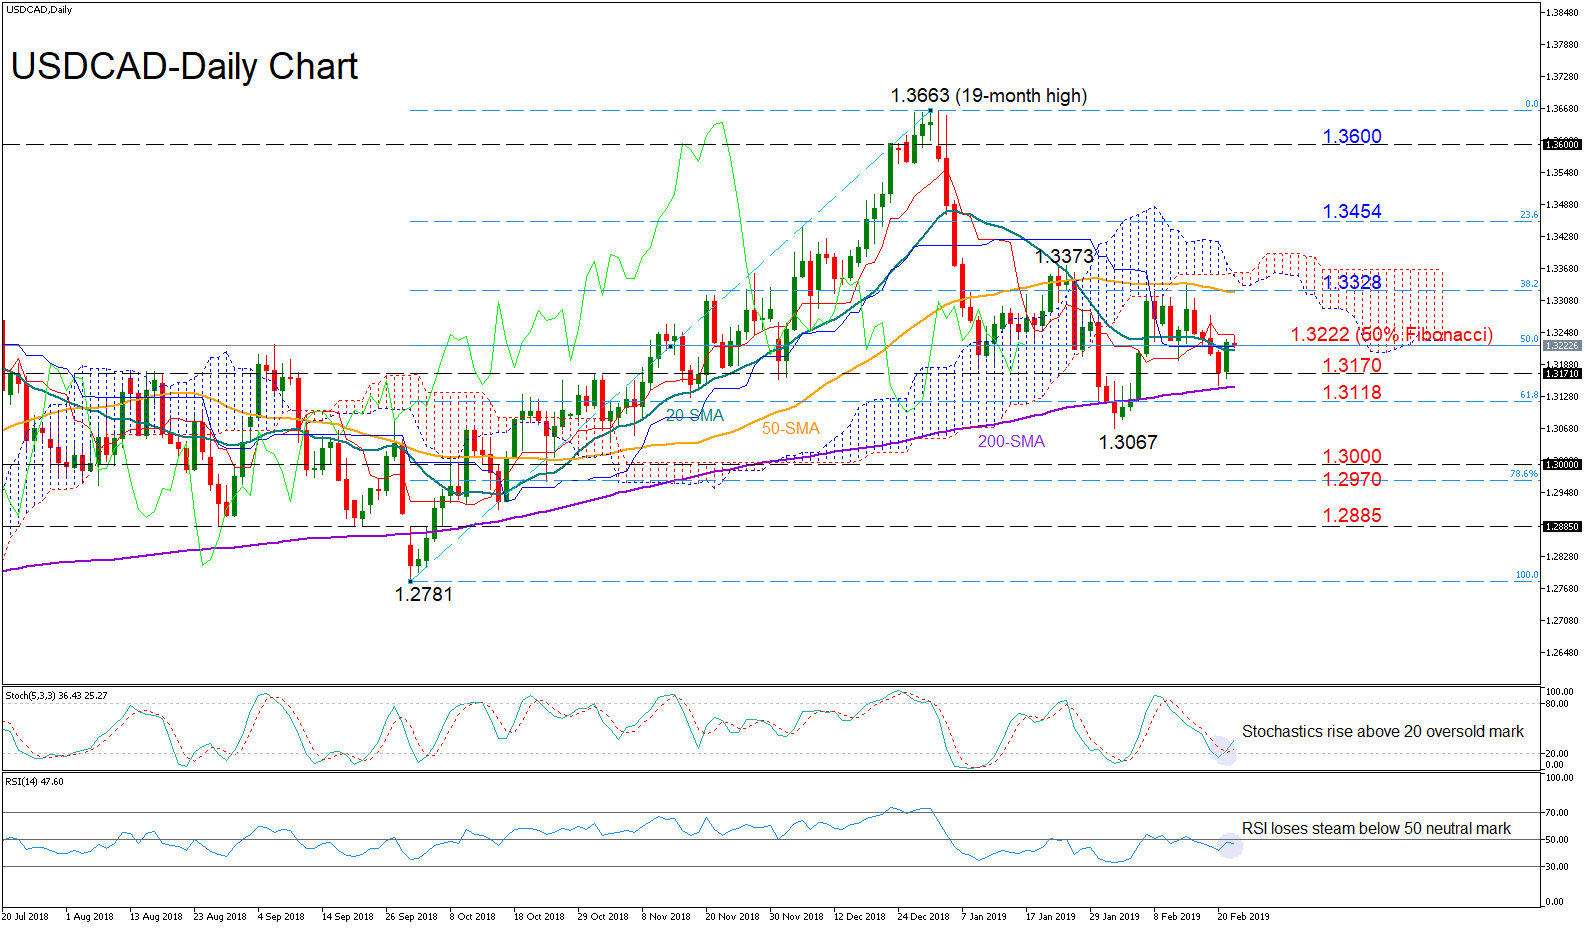
 USDCAD was supported by the 200-day moving average (MA) this week before turning higher and back above the 50% Fibonacci of the upleg from 1.2781 to 1.3663.
The fast-Stochastics hint that the pair is likely to improve further as the blue % K line and the red %D line are exiting the oversold area. Positive signals, however, are not sufficient yet given the RSI’s location and the movement of the Ichimoku’s indicators; the RSI seems to be losing momentum marginally below its 50 neutral mark, while the red Tenkan-sen lacks direction slightly above the blue Kijun-sen line which is also flat.
Heading further up, the price could find immediate resistance in the crossroads of the 50-day MA and the 38.2% Fibonacci of 1.3328, where the bullish action topped last week. A stronger rally could surpass the previous high of 1.3373 and challenge the 23.6% Fibonacci of 1.3454, any violation of which would open the way towards the 1.36 resistance zone.
Should selling pressure resume beneath the 50% Fibonacci of 1.3222, nearby support could be met between 1.3170 and the 61.8% Fibonacci of 1.3118. Lower, the bears will push hard to beat the 1.3067 bottom to lead market below the 1.30 mark and towards the 1.2970 restrictive level. If the latter fails to hold, another hurdle could arise around 1.2885.
In the medium-term timeframe, USDCAD continues the neutral phase as long as it fluctuates within the 1.3663-1.30 region.
Origin: XM


