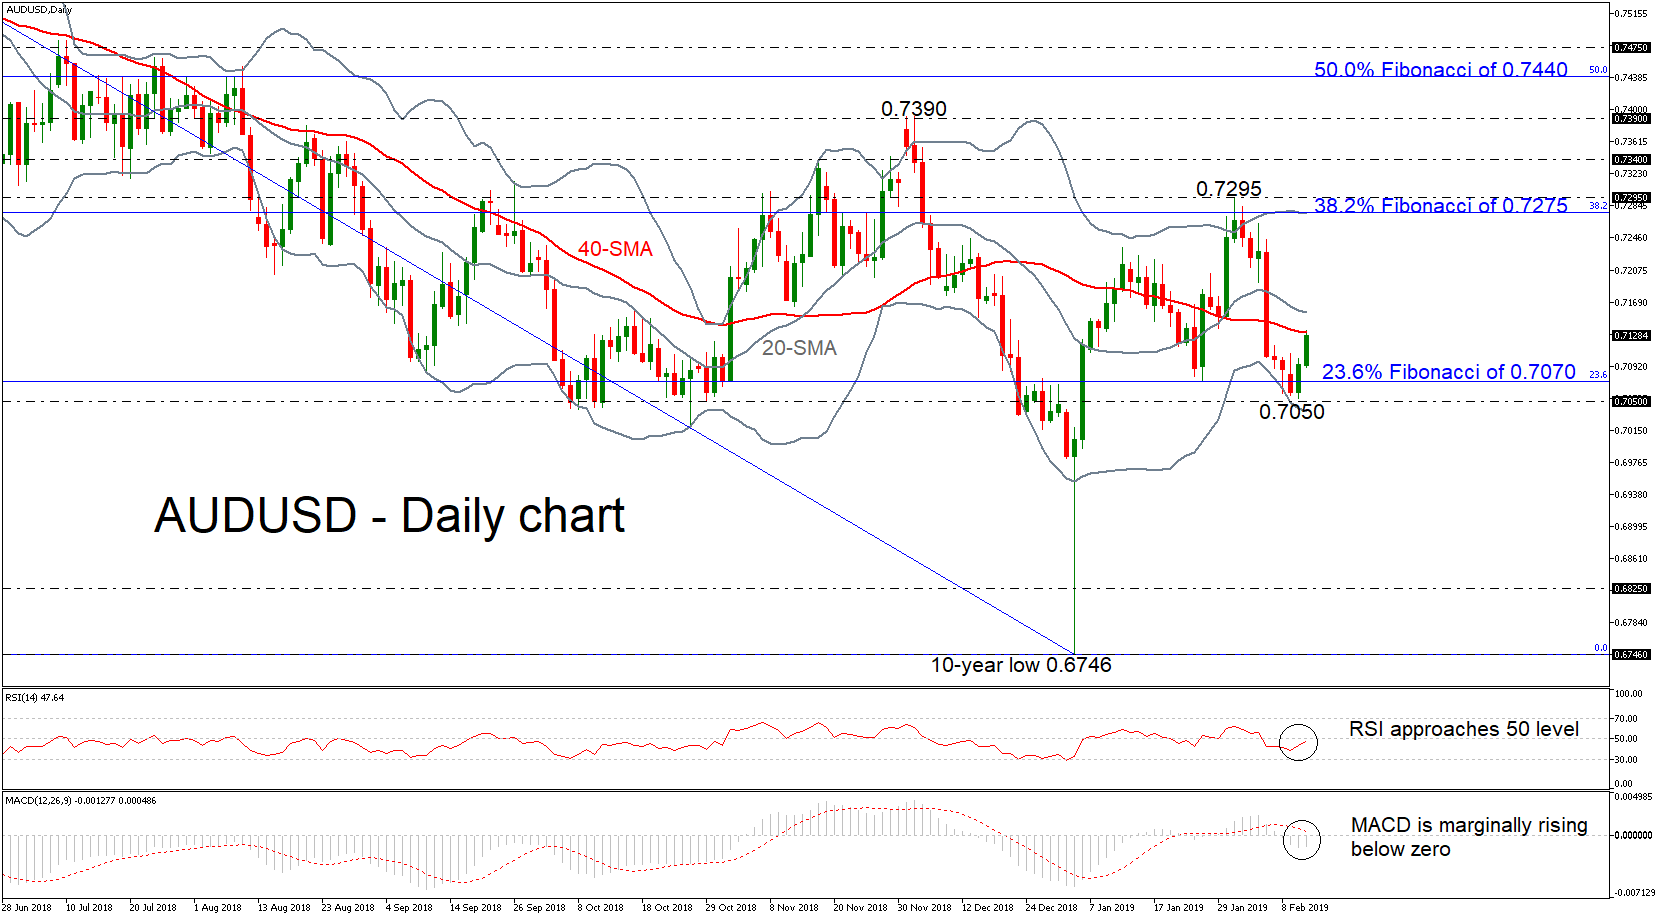
 AUDUSD has been paring some of the previous days’ losses since yesterday, following the rebound on the 0.7050 support level. Currently, the price is challenging the 40-simple moving average (SMA) in the daily timeframe, successfully surpassing the 23.6% Fibonacci retracement level of the downleg from the 32-month high of 0.8135 to the 10-year low of 0.6746, around 0.7070.
From the technical point of view, the Bollinger Bands have confined prices between the 38.2% Fibonacci of 0.7275 and the 0.7050 support barrier over the last few sessions. The RSI indicator is pointing upwards, approaching the bullish area, while the MACD oscillator is trying to strengthen its positive momentum in the negative zone.
Should prices edge higher, the mid-level of the Bollinger Band (20-SMA) could provide immediate resistance currently at 0.7157. Moving higher, the focus would shift to the 38.2% Fibonacci 0.7275 and the 0.7295 high, while more bullish actions could drive aussie/dollar towards the 0.7340 mark, identified by the peak on November 16.
In the alternative scenario, traders would be eagerly looking for a break below the 0.7050 support to increase selling orders. If that’s the case, the sell-off could last until the 0.6825 barrier, registered on January 2016. If bearish forces appear even stronger, the decade low should be another support to keep in mind.
In the long-term view, AUDUSD has been retaining its descending movement over the last year. Chances for a strong bullish tendency would only come if the pair breaks the 61.8% Fibonacci of 0.7600.
Origin: XM