


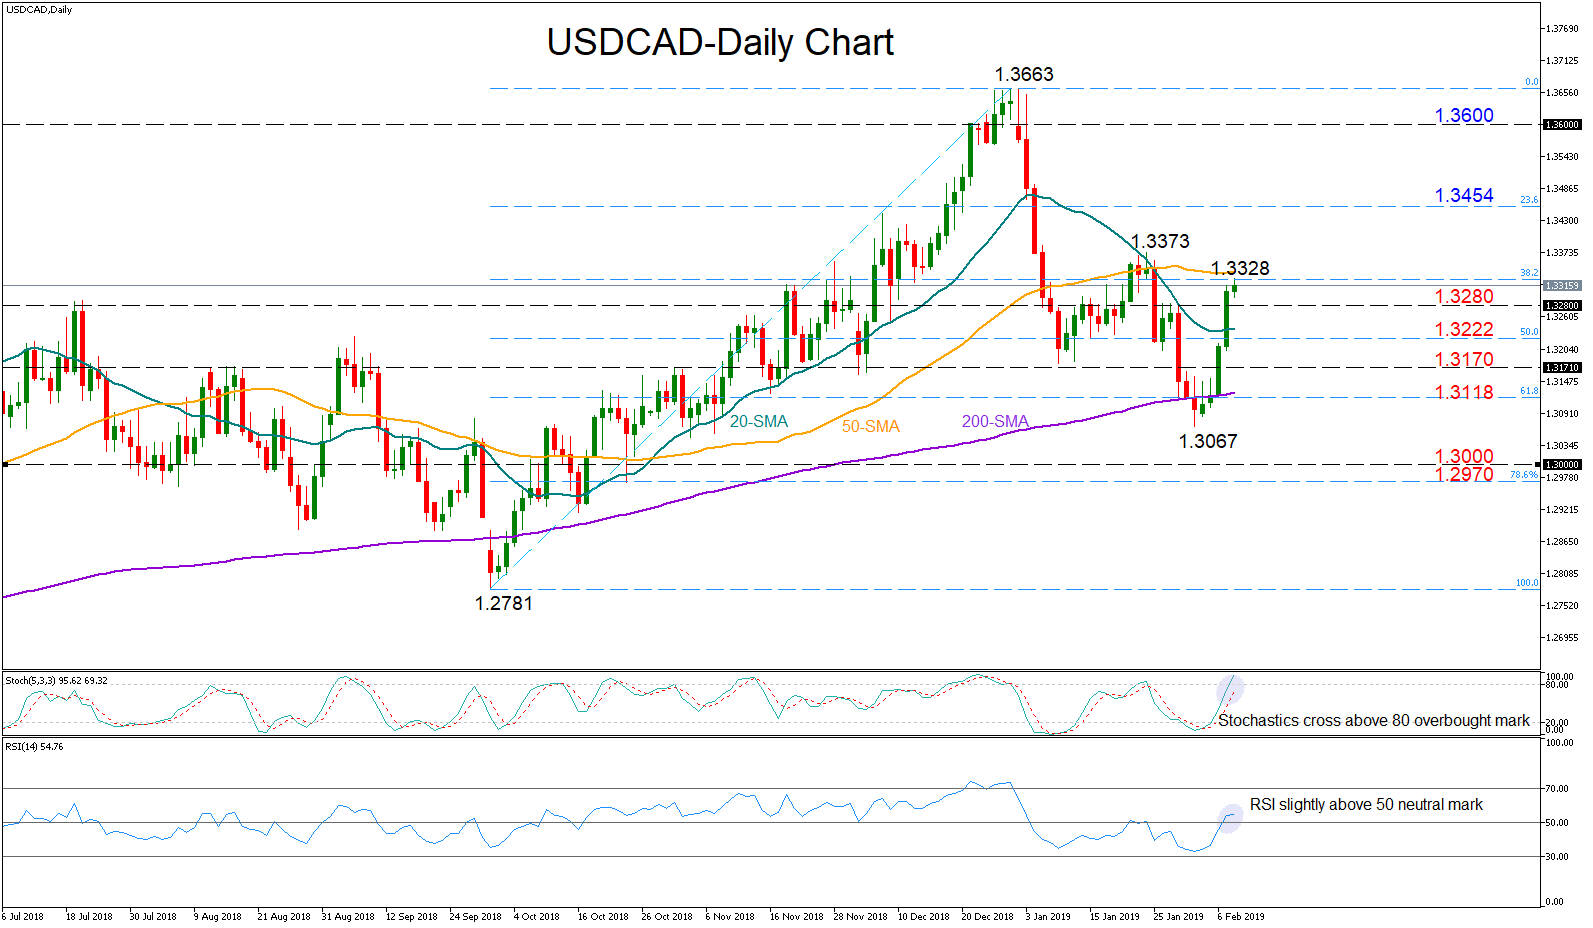
 USDCAD has maintained bullish momentum for the fifth consecutive trading day, reaching two-week highs at 1.3328 on Friday. In the short-term, the RSI is signaling further improvement as the indicator is rising above its 50 neutral mark. Yet with the fast stochastics rising towards the overbought threshold of 80, downside corrections cannot be ruled out.
An extension above today’s high of 1.3328 would shift attention towards the previous peak of 1.3373 as any violation at this point would break the downward trend started at the end of December. If that’s the case, the pair could increase gains towards the 23.6% Fibonacci of 1.3454 of the upleg from 1.2781 to 1.3663. Higher, the bulls could retest the 1.36 round level before moving up to the 1.3663 top.
On the downside, the congested area between 1.3280 and the 50% Fibonacci of 1.3222 could act as support ahead of the 1.3170 barrier. Moving lower, a drop below the 200-day simple moving average which currently lays along the 61.8% Fibonacci of 1.3118 and more importantly below the 1.3067 trough could bring further losses, with the price probably stopping next near the 78.6% Fibonacci of 1.2970.
In the medium-term, USDCAD continues to hold a neutral outlook as long as it holds within the 1.3663-1.30 region.
Origin: XM


