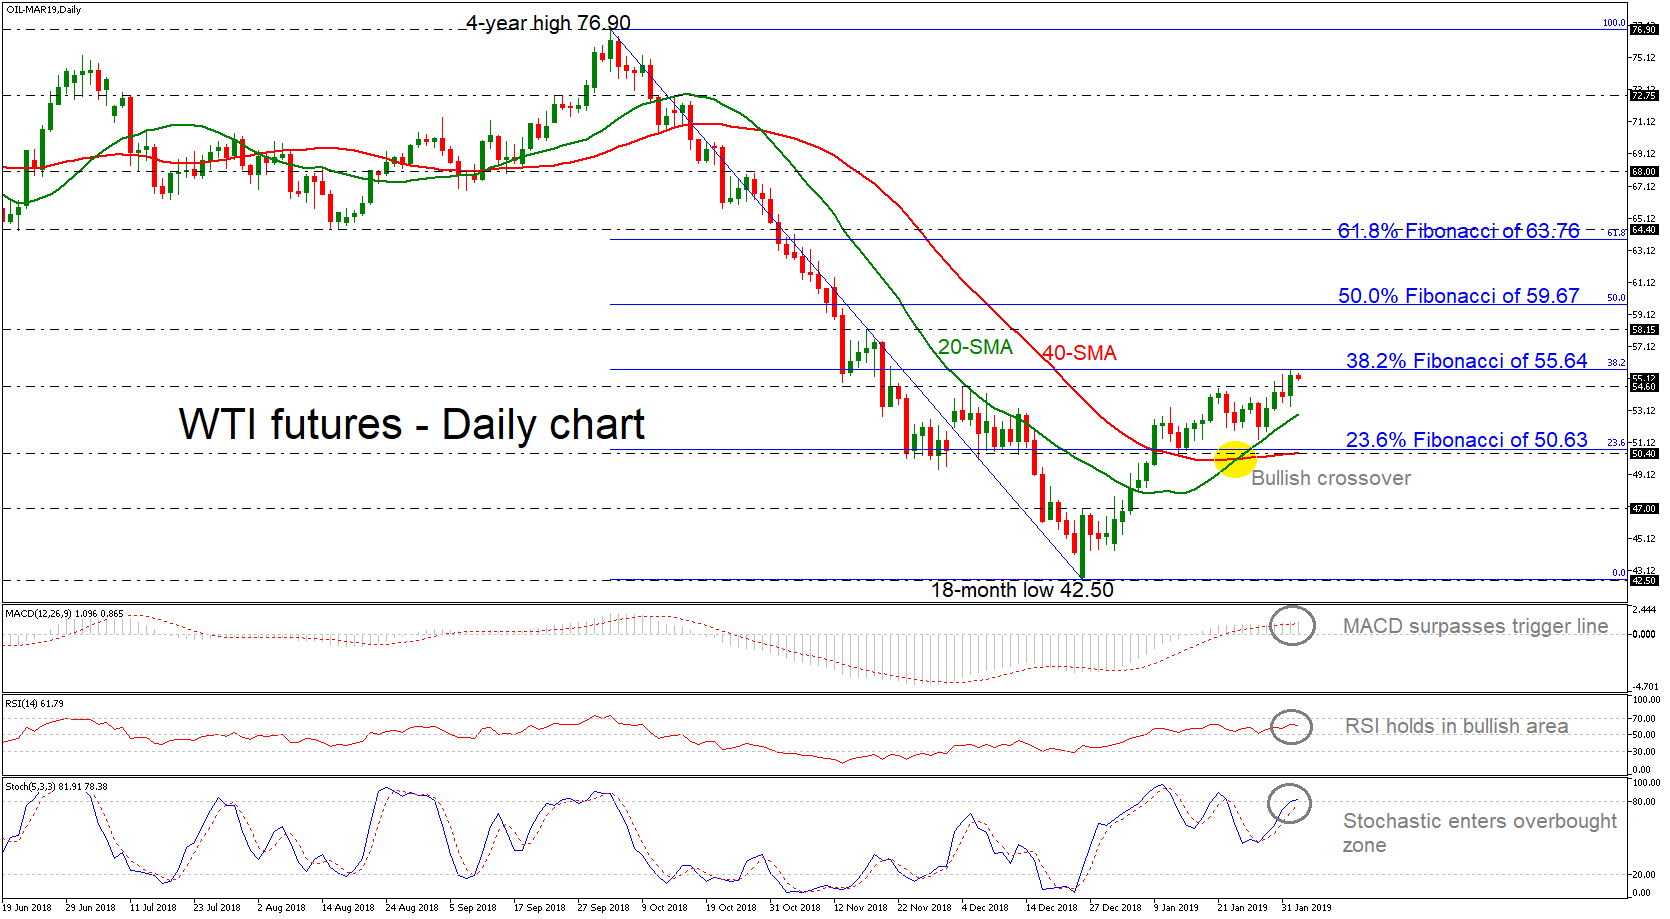
 WTI futures came close to breaking the 38.2% Fibonacci retracement level of the downleg from the four-year high of 76.90 to the 18-month low of 42.50, around 55.64, reaching a fresh two-month high on Friday. The price remains in a bullish correction mode as it jumped above the 20- and 40-simple moving averages (SMAs), which posted a positive crossover in the preceding sessions in the daily timeframe.
According to the technical indicators the market could maintain positive momentum in the short-term as the MACD indicator has surpassed the trigger line and holds in the positive zone, while the RSI is positively sloped above its neutral threshold of 50 and lies near the 70 level. However, the fast Stochastics suggest that the market is located in overbought territory and therefore some weakness is possible; the blue %K line is losing speed over the red %D line in overbought zone above 80.
On the upside, the price could attempt to overcome the 38.2% Fibonacci and retest the 58.15 resistance level, which if successfully broken the door could open for the 50.0% Fibonacci mark of 59.67. Should traders continue to buy oil above that region, strengthening the short-term positive bias, resistance could then run towards the 61.8% Fibonacci of 63.76.
A reversal to the downside, however, could find immediate support at the 20-day SMA currently at 52.85, while slightly lower the 23.6% Fibonacci of 50.63 and the 40-day SMA near 50.40 could be a critical zone for the bears. If the latter fails to halt bearish movements, the next target could be at the 47.00 round number, taken from the inside swing top on December 26.
Turning to the medium-term, the outlook seems to be neutral and only a decisive close above the 61.8% Fibonacci could create a bullish picture. On the other hand, a close below the December’s low could shift the outlook back to bearish.
Origin: XM