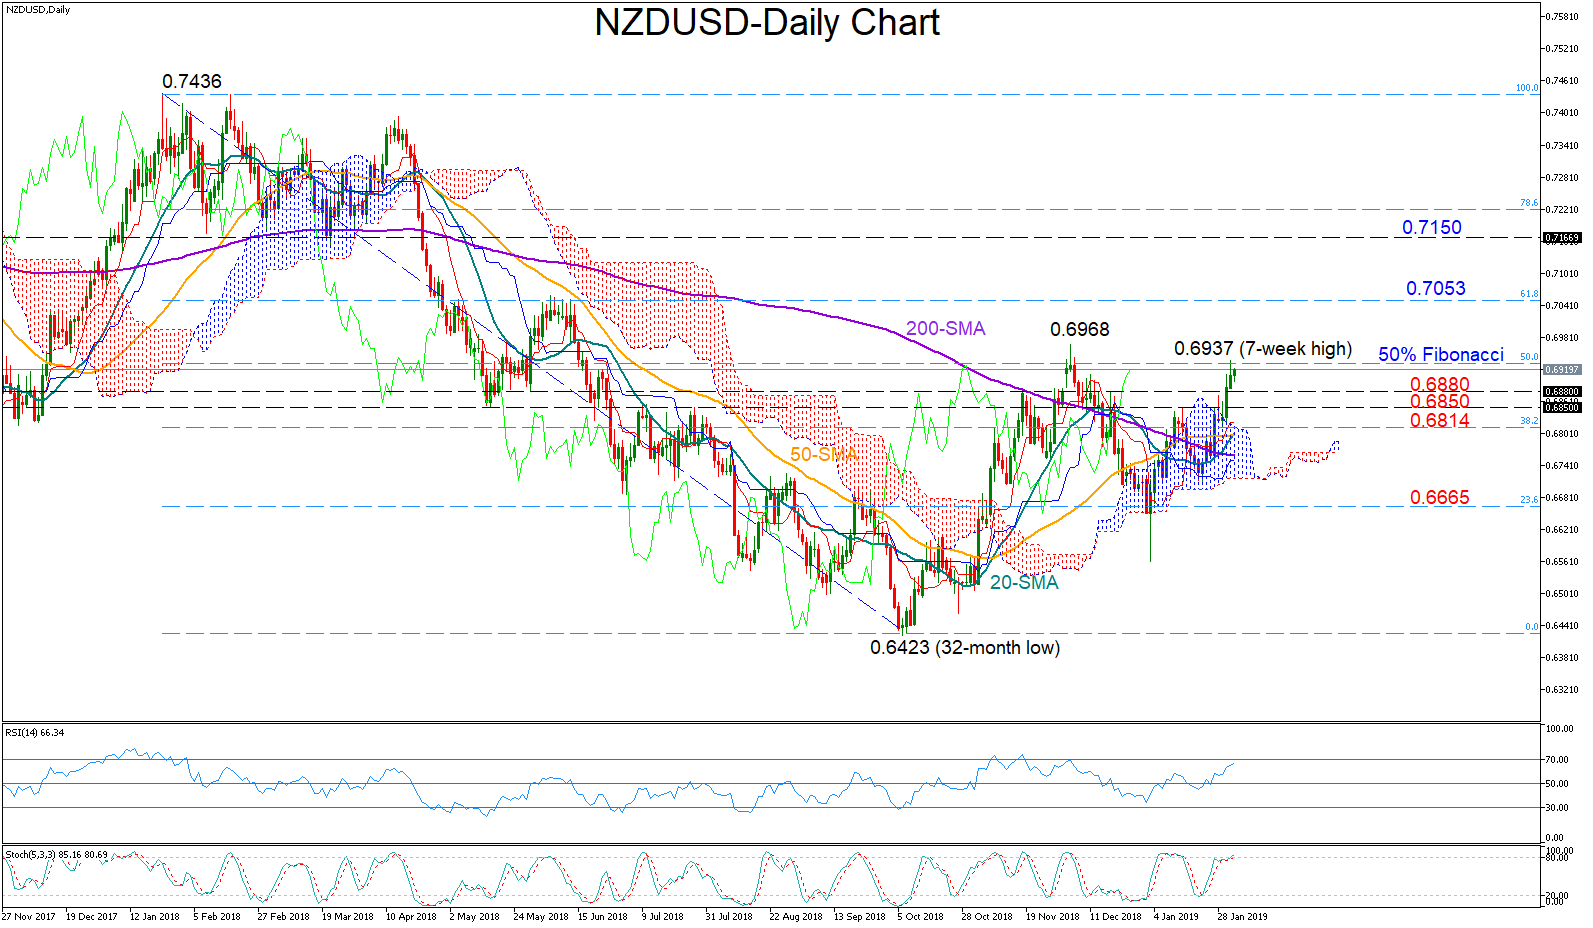
 NZDUSD recorded three green days in row to reach a seven-week high of 0.6937 on Thursday. On Friday, the pair is trading slightly weaker, with the RSI indicating that room for improvement is limited as the indicator seems to be slowing down above 50 and slightly below the 70 overbought threshold. Stochastics are also set to enter the overbought territory above 80 but they have yet to register a clear bearish crossover, while the red Tenkan-sen line seems to be flattening above the blue Kijun-sen line.
On the upside, the bulls may retest yesterday’s peak of 0.6937 which overlaps with the 50% Fibonacci of the long downleg from 0.7436 to 0.6423. Breaching that level, the spotlight would turn to the 0.6968 top on December 4, where any decisive close higher could increase buying confidence, with the price probably flying up to the 61.8% Fibonacci of 0.7053.
On the flipside, a move southwards could pause somewhere between 0.6880-0.6850 before the 38.2% Fibonacci of 0.6814 comes into view. Further below, the 200-day simple moving average (MA) currently at 0.6758 would gather special attention as any step under that line could trigger steeper declines, shifting the focus towards the 23.6% Fibonacci of 0.6665. Another leg lower would possibly signal the sideways move has ended and therefore a downtrend is in progress.
In the medium-term picture, NZDUSD is in a neutral phase, trading within the 0.6968-0.6560 range. While the golden cross between the 50- and the 200-day MAs has increased optimism that a bull market could soon come back into play, investors would likely wait more improvement from the 50-day MA before increasing their buying orders.
Origin: XM