


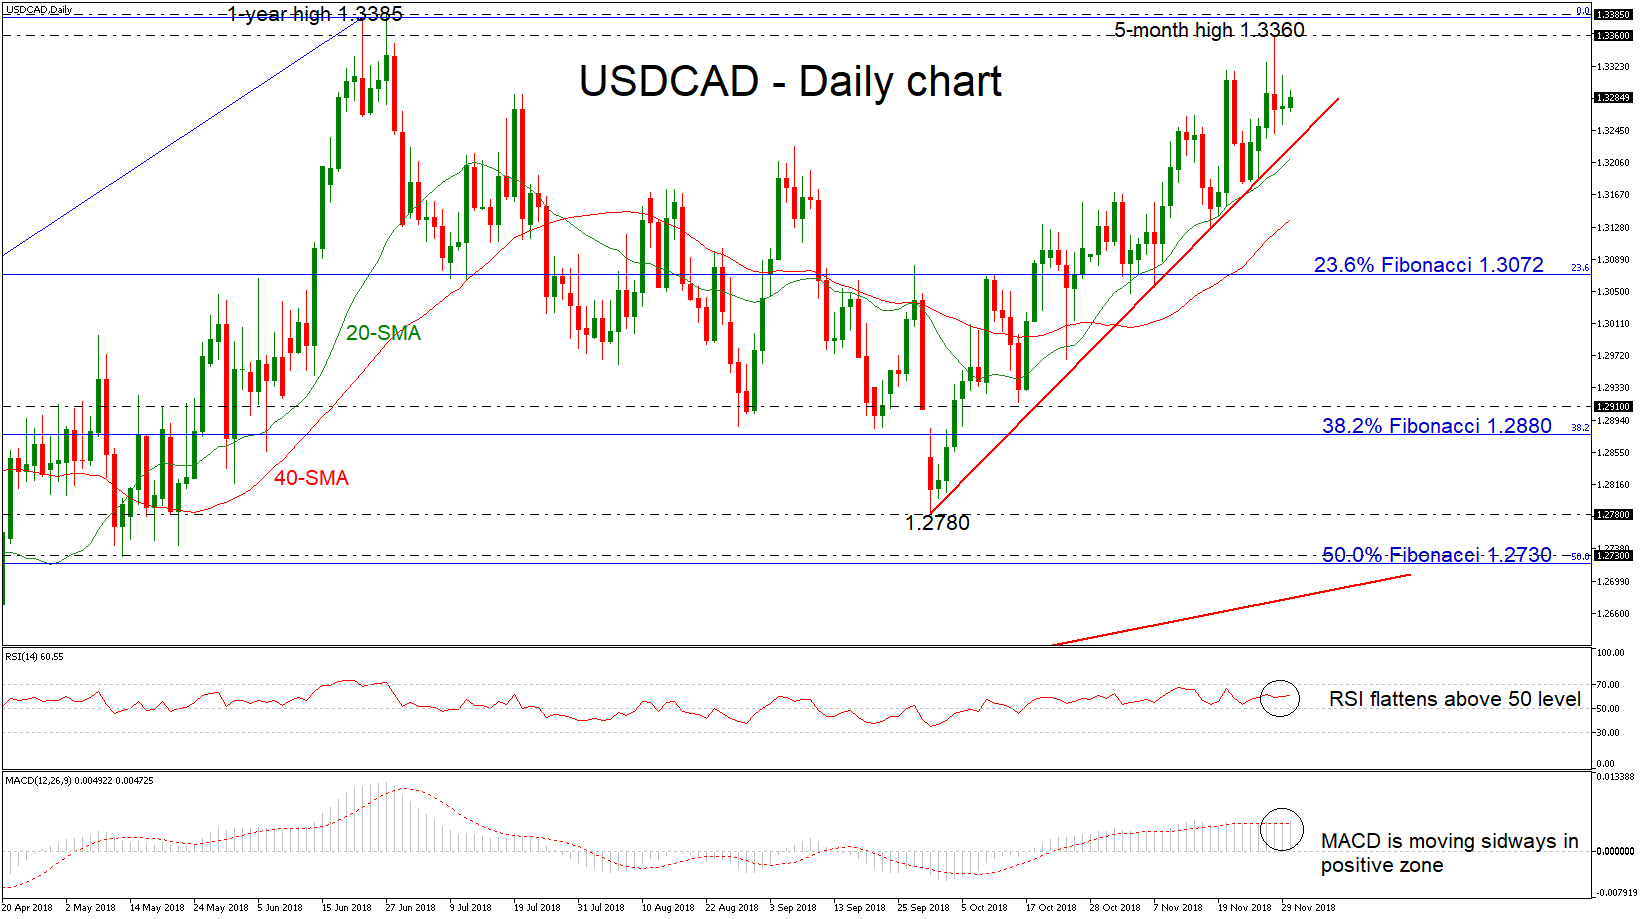
 USDCAD returned some of the gains that posted on November 28, completing a five-month high around 1.3360. The pair has been trading in an ascending movement over the last almost two months, but in case of a penetration of the trend line it could move lower in the near term. Also, when looking at the bigger picture the pair has a clear upside trend after its rebound on the 1.2060 support level.
From the technical point of view, the RSI indicator is flattening in positive territory, failing to provide a sustained move higher, while the MACD oscillator is moving sideways near the trigger line in the bullish zone. The 20- and 40-simple moving averages (SMAs) could act as strong support levels for traders, as the price holds above them.
If the price successfully surpasses the 1.3360 multi-month high, it could hit the 1-year peak of 1.3385, achieved on June 27. More advances could send the market even higher, increasing the chances of a fresh high in the long-term view. The next resistance is coming from the 1.3550 level, where it topped on May 28.
In the event of negative pressures and a slip below the short-term rising trend line as well as below the 20-day simple moving average (SMA) the pair could challenge the 40-SMA level near 1.3136, before heading towards the 23.6% Fibonacci retracement level of the upleg from 1.2060 to 1.3385, around 1.3072.
Overall, the pair seems to be in an upside tendency in the short- and long-term view, as it holds above both rising trend lines.
Origin: XM


