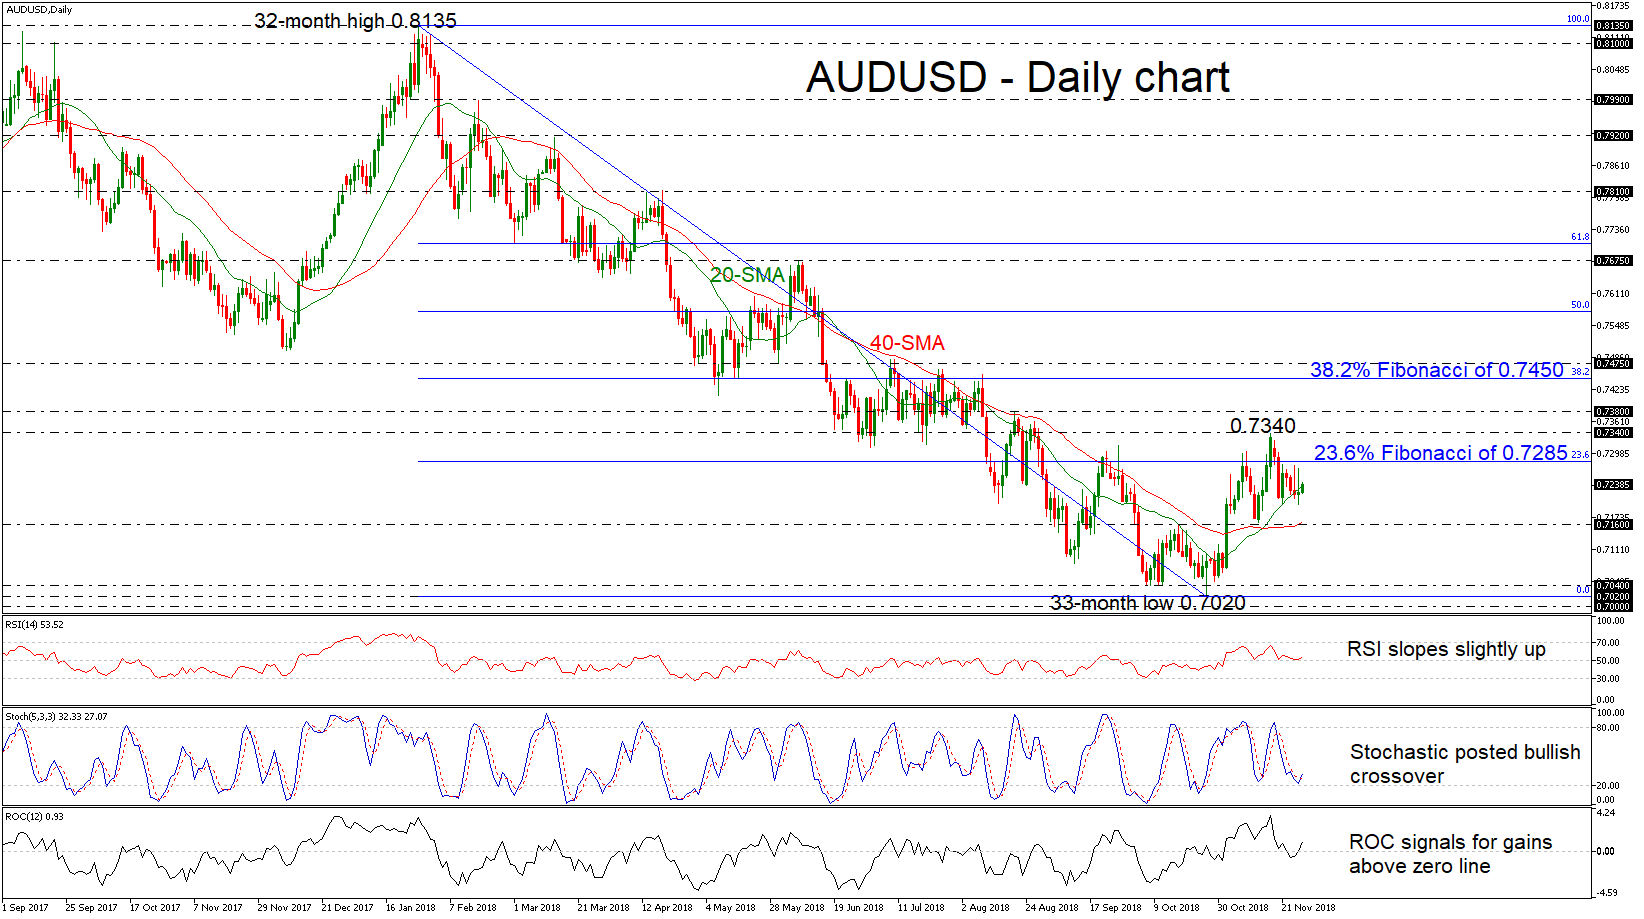
 AUDUSD lost its strong upward momentum over the last week after its fall from the two-and-a-half-month high near 0.7340, reducing the chances for a strong bullish correction. The price started the day in bullish territory, however, it is finding some resistance around the 20-day simple moving average (SMA) near 0.7240.
In the short-term, the technical indicators remain in bullish mode with the RSI pointing slightly up, above the neutral threshold of 50, while the red %K line of the stochastic oscillator recorded a positive crossover with the blue %D line above the oversold zone. Moreover, the ROC oscillator surpassed the zero line, signaling possible gains.
On the upside, the 23.6% Fibonacci retracement level of the strong downward movement from 0.8135 to 0.7020, near 0.7285 could be the next immediate resistance for investors to have in mind. Beyond this region, resistance could then run towards the 0.7340 – 0.7380 zone before the 38.2% Fibonacci of 0.7450, which overlaps with the highs on August 8, comes into play again.
On the flipside, should the price fail to climb above the 20-day SMA, it would be interesting to see a retest of the 0.7160 support level, which roughly coincides with the 40-day SMA. Even lower, the market would increasingly eye the 0.7000 – 0.7040 significant support area, which encapsulates the 33-month low of 0.7020.
Summarizing, AUDUSD seems to be in bullish retracement mode after the rebound on the 0.7020 support but it has not given concrete signals for a strong upside movement in the short term.
Origin: XM