


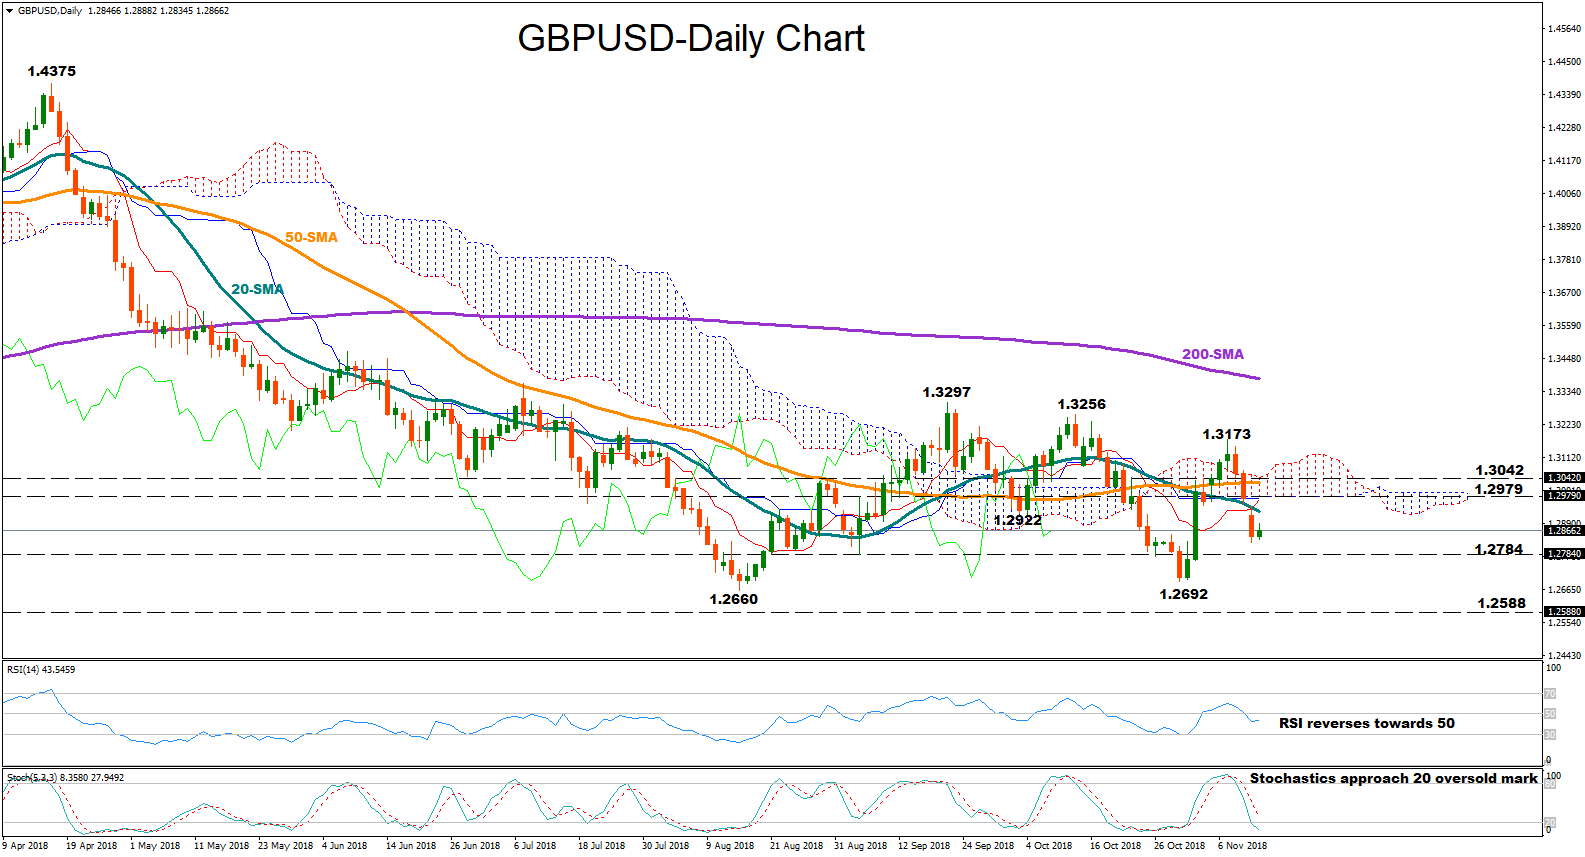
 GBPUSD declined back below the Ichimoku cloud and the 1.2900 key level on Monday, erasing part of its recent strong rebound. Momentum indicators, however, signal that the market may attempt to retrace its losses in the short-term as the Stochastics are on track to create a bullish cross in the oversold territory, below 20, while the RSI looks to be changing direction to the upside and towards its 50 neutral mark. Yet, as long as the RSI holds below 50, negative corrections cannot be ruled out
A bounce up could see immediate resistance between 1.2922 and 1.2979 identified by the low on October 4 and the bottom of the Ichimoku cloud. Slightly higher, the area around 1.3042 which restricted both upside and downside movements in the past could stand as a barrier, while if this fails to hold, bullish actions may then try to overcome the previous peak at 1.3173.
On the downside, the focus will shift to 1.2784, a previous support region, before the 1.2692 trough comes under the radar. A decisive close lower and more importantly below the August 15’s low of 1.2660 may open the way towards 1.2580 where the pair registered a significant rebound on June 2017.
Looking at the medium-term picture, GBPUSD maintains a neutral outlook over the past three months, ranging between 1.2660 and 1.3297. Any violation of these boundaries would adjust the market sentiment accordingly; a leg above 1.3297 would bring the bullish picture back into play, while a step below 1.2660 would resume the long-term bearish phase off 1.4375.
Origin: XM


