


 4 hour
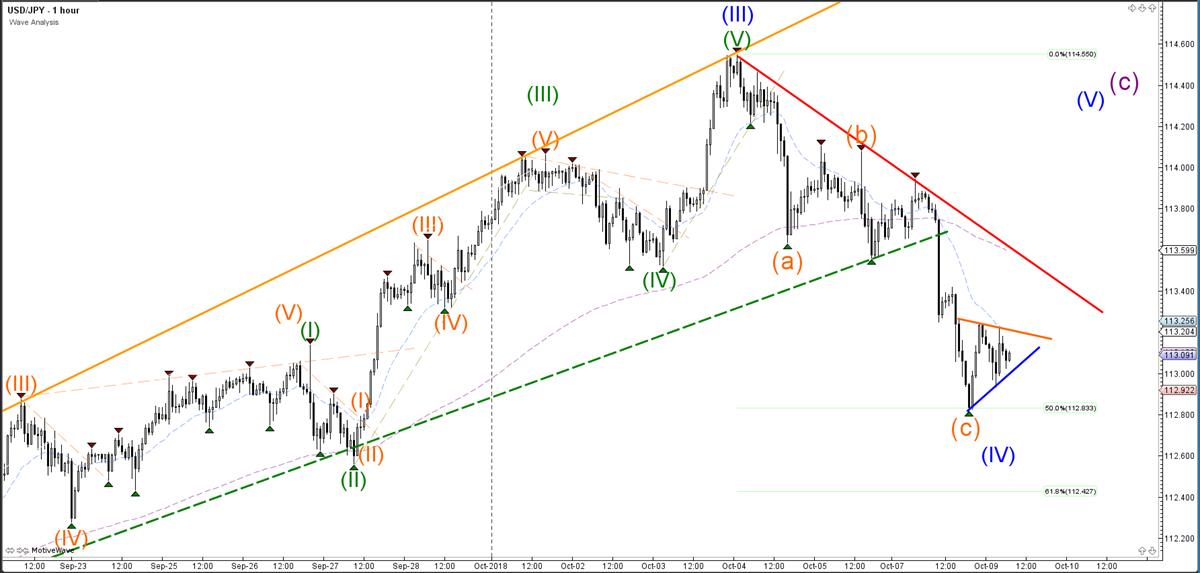
The USD/JPY currency pair broke below the support trend line (dotted green) for a bearish breakout, but the price is now approaching the Fibonacci retracement levels of wave 4 vs 3. The 50% Fibonacci retracement level at 112.83 could be a key bounce or a break spot for the wave 4 (blue). A bearish break below it could indicate that a different wave pattern is more likely, whereas a bullish bounce and a breakout could confirm the development of a wave 5 (blue).
1 hour
The USD/JPY currency pair needs to break above the resistance trend lines (orange and red), with strong bullish candlestick patterns before the end of the wave (blue), and the start of the wave 5 (blue) becomes more likely.
4 hour

1 hour
Origin: Admiral Markets


