


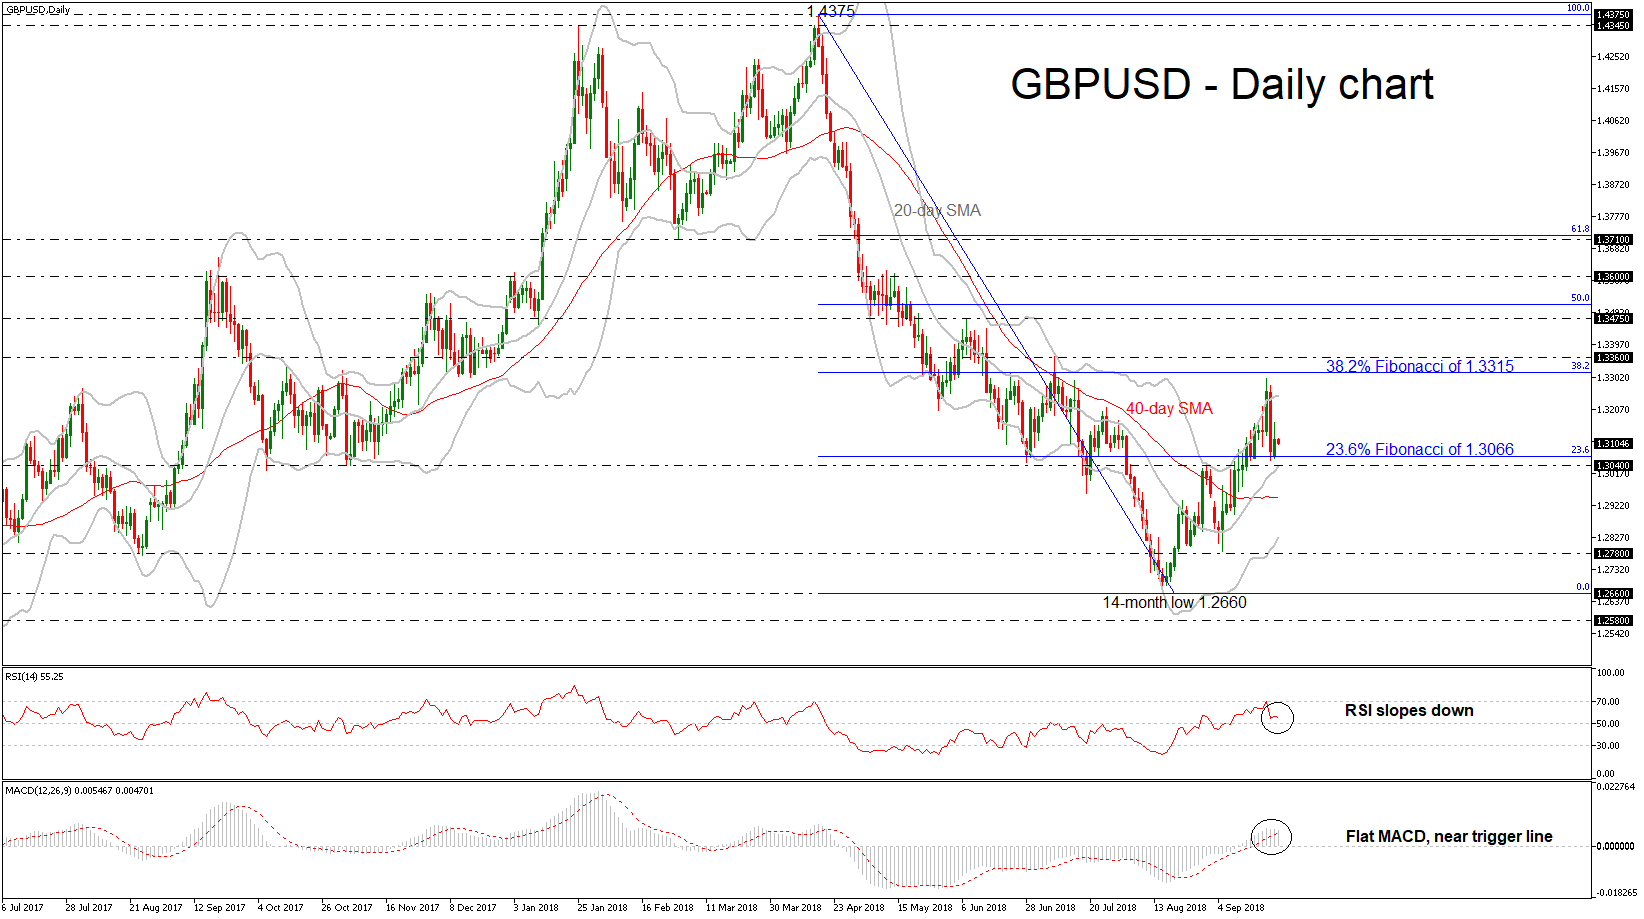
 GBPUSD erased some of Friday’s significant losses yesterday and still remains above the 23.6% Fibonacci retracement level of the downleg from 1.4375 to 1.2660. The buying interest following the rebound on the 1.2660 support level has shifted the bearish outlook to a neutral one. Moreover, the 20-day simple moving average (SMA) created a bullish crossover with the 40-day SMA in the near-term, indicating a continuation of the upside correction move.
However, the momentum indicators are losing their positive momentum. The RSI indicator is moving slightly lower in the bullish zone, while the MACD oscillator remains flat near the trigger line and above the zero line.
Should the pair manage to strengthen its bullish bias, the next resistance could come around the 38.2% Fibonacci mark of 1.3315. A break above this region would shift the near-term tendency to a more bullish one and open the way towards the immediate resistance of 1.3360 and then until the 1.3475 barrier, taken from the peak on June 7.
If prices are unable to break the upper band of the Bollinger Band in the next few sessions, the risk would shift back to the downside, with the mid-level of the Bollinger band once again coming into focus, as well as the 1.3040 support level. A drop below this zone would signal a resumption of the longer-term downtrend. The next key level support to watch is 1.2780.
Having a look at the bigger view, sterling has been developing in a bearish structure against the greenback since April and it seems set for a possible upside retracement. However, it needs first to surpass the 38.2% Fibonacci before switching to a possible bullish short-term bias.
Origin: XM


