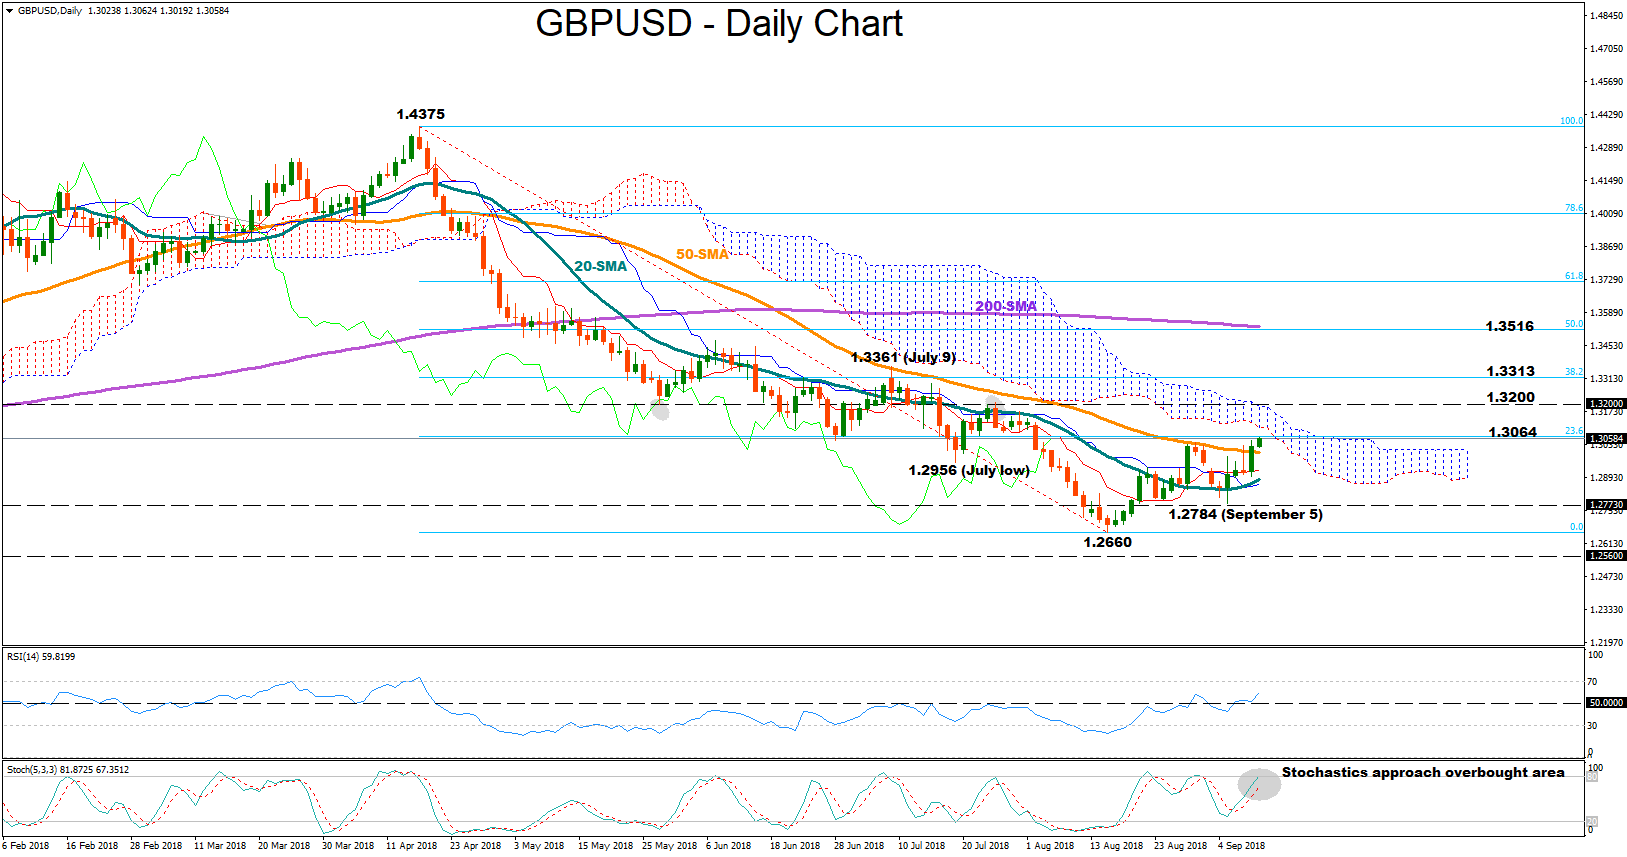
 GBPUSD closed the day slightly above the 50-day simple moving average on Monday for the first time since mid-April and continued to extend higher above 1-month highs in the following session. In the short-term, the market could maintain its positive momentum as the RSI gains ground above its 50-neutral mark and the red Tenkan-sen line holds above the blue Kijun-sen line. However, according to the stochastics, the upside move might not last for long, as the green %K line and the red %D line come close to the overbought area.
If the move higher is extended, the pair could touch the 23.6% Fibonacci of the downleg from 1.4375 to 1.2660, near 1.3064, which has been tested a number of times in the past. Should the price overcome that level, resistance could run towards the 1.3200 psychological level before bulls visit the area between the 38.2% Fibonacci of 1.3313 and July 9’s peak of 1.3361.
On the downside, immediate support could come between 1.30 and 1.2956 where the 50-day SMA and July 19’s low are placed, while lower than that the market could try to break the 1.2784 trough registered on September 9 ahead of the 1.2660 bottom.
In the medium-term, the market remains bearish given the three-month downside move. In order for the bullish outlook to take hold, the price needs to cross above the 50% Fibonacci of 1.3516, while the negative status would deteriorate if bears drive the pair below 1.2660.
To sum up, the market looks positive in the short-term, while in the medium term GBPUSD continues to trade bearish.
Origin: XM