


 4 hour
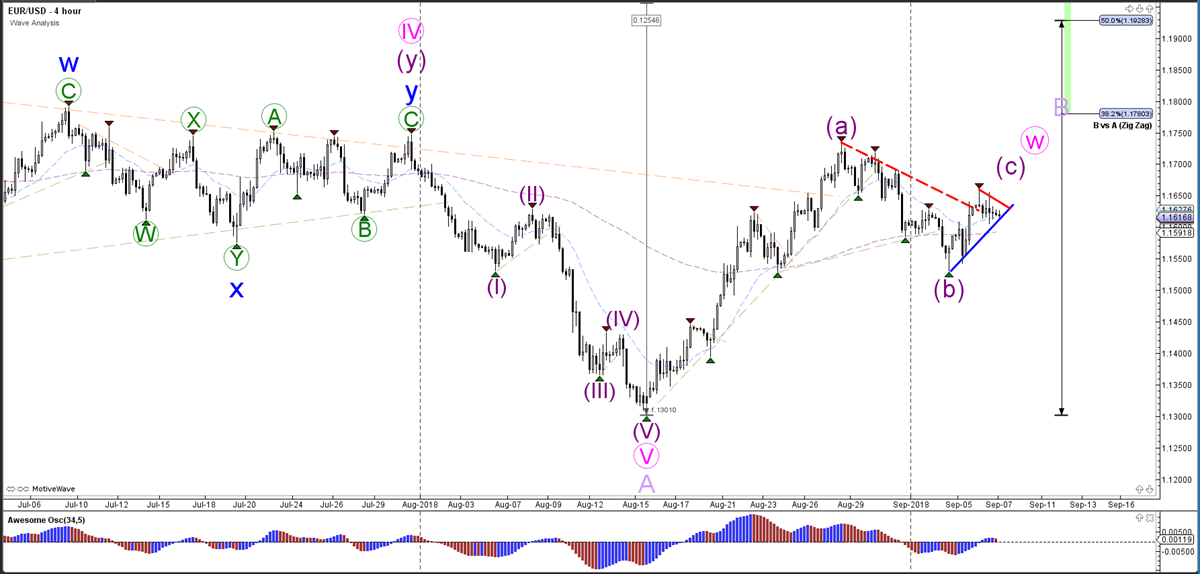
The EUR/USD seems to be building a bullish ABC zigzag (purple). The price will need to break above the resistance trend line (red) before it can confirm the wave C pattern, whereas a break below the support trend line could indicate a deeper wave B (purple), which could test the support zone at 1.15 again.
1 hour
The EUR/USD has broken above the resistance trend line (dotted red) but is now moving sideways and is building a chart pattern. The price could be in a wave 4 (green) pattern as long as it stays above the 61.8% Fibonacci support level.
4 hour
1 hour

Origin: Admiral Markets


