 4 hour
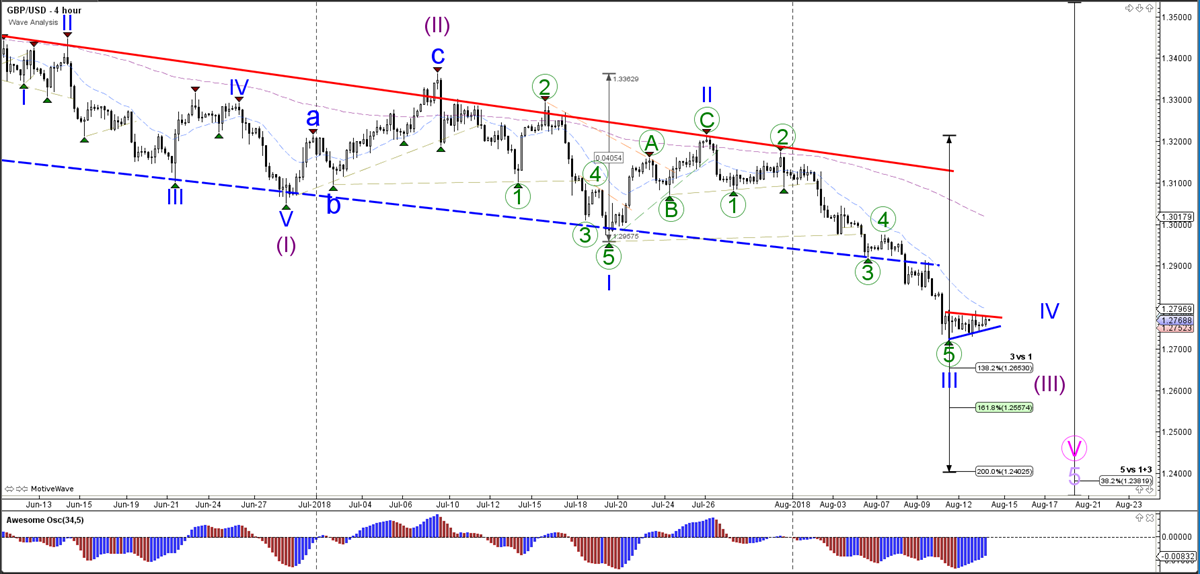
The GBP/USD is building a triangle pattern after breaking below the support line (dotted blue) of the downtrend channel. A new bearish breakout could indicate an immediate continuation within wave 3 (blue), which could fall towards the Fibonacci targets of wave 3 vs 1.
1 hour
The GBP/USD is building a sideways corrective chart pattern. A bearish breakout could indicate a longer wave 3 (blue) whereas a bullish break could see a bullish retracement within wave 4 (blue). The Fibonacci levels of wave 4 vs 3 could act as resistance.
4 hour
1 hour

Origin: Admiral Markets